Formatting Tabular reports in Visualizer
Tables and crosstab reports use similar formatting techniques.
Some formatting activities you perform directly on the table, such as:
- Show/hide Grand Summary
- Wrap headers and cells
- Change label
- Resize column width
- Reorder columns
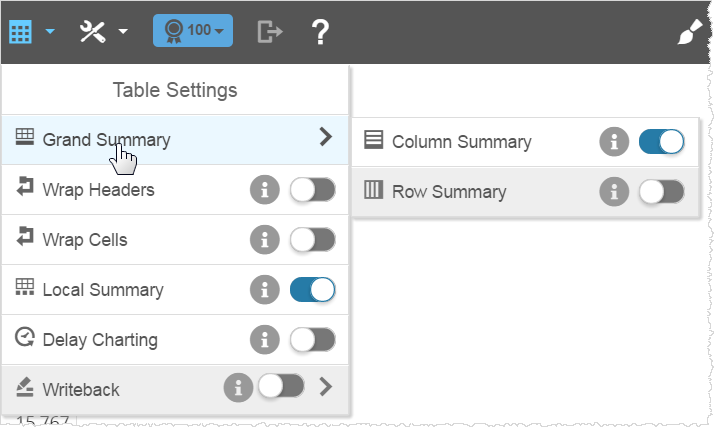
To show/hide the default Grand Summary:
By default, Visualizer adds a Grand Summary at the bottom of measure columns. To enable this option, select and enable the relevant toggle setting.
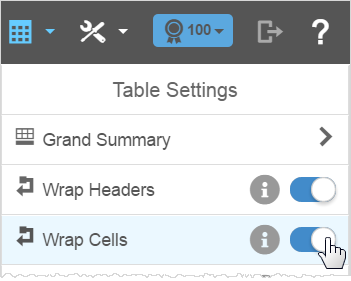
To wrap headers and cells:
The Table Settings wrap options apply to entire tables or cross tabs. When headers are too long, select the toggle. For cells, select the toggle.
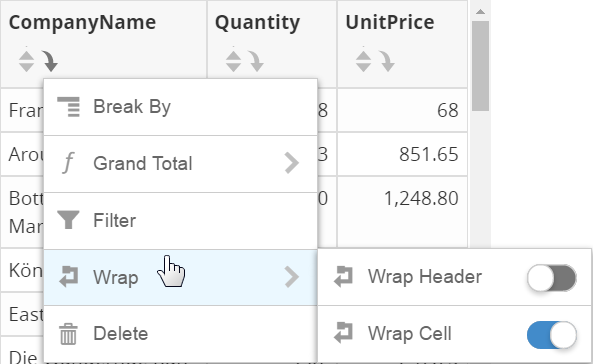
To wrap headers and cells of individual columns, use the column formatting menu options.

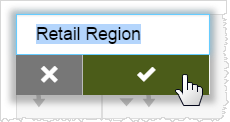
To edit a label:
To change the label of a column, double-click the label, enter the new value, and click the check box.

To change column width:
The default column width is 95 pixels. The shortest width is 40 pixels.
Re-size width by dragging the column edge in the header.


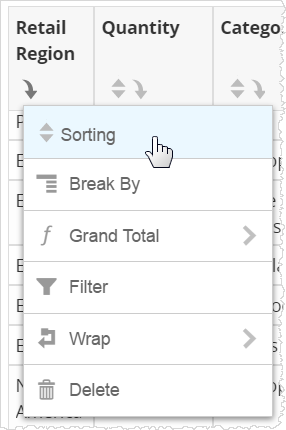
When a column is narrow, the table Sorting option moves into the Column formatting drop-down menu.
To reorder columns:
Reorder the columns by hovering in the header to reveal the Reorder  button. The pointer changes to indicate that you have selected the column

and you can drag it to another location. A blue bounding box shows where the column will move.
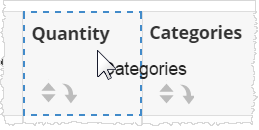
 button. The pointer changes to indicate that you have selected the column

and you can drag it to another location. A blue bounding box shows where the column will move.
