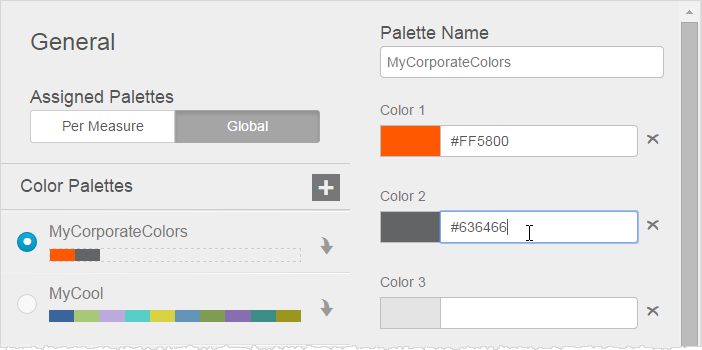
Adding a color palette
- Click Chart Formatting (paintbrush icon). The Chart Formatting panel opens.
- Click the General tab to see the palette options.
- For the Assigned Palettes field, click either Per Measure or Global, depending on the scope of the changes.
- Click Add New Palette (the + icon).
- Name your new palette.
- Select either Manual or Auto.
- For manual palettes, use the Color Picker or enter the hex values for the colors. When you finish one color another field appears.

As you enter the colors, the chart previews them.Note: The order of the colors, from left to right, determines the default order of the colors as they are applied in charts. - For auto palettes, specify values in the Number of Colors in Palette, Start Color, and End Color fields.
- Click Generate Palette. This generates a palette with the set number of colors with gradients between the start color and end color.
- For manual palettes, use the Color Picker or enter the hex values for the colors. When you finish one color another field appears.
- When you finish your palette, click Done. The new palette displays in the Chart Formatting Color Palettes tab.