Adding shapes to visualizations
Some visualizations are more useful when you add an attribute represented as Shape.
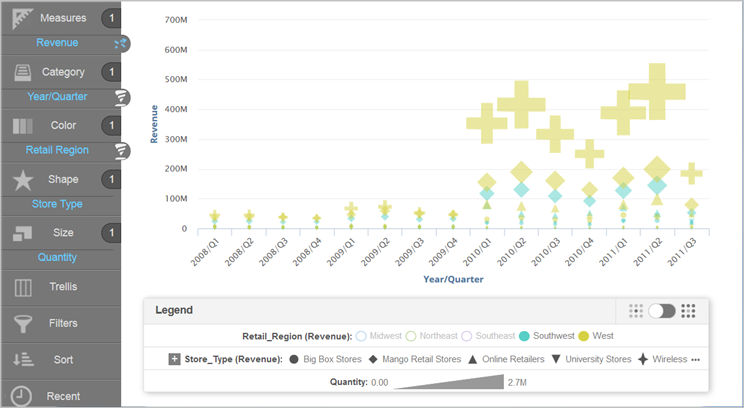
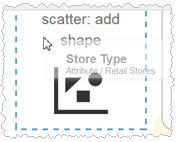
For example, drag the Store Type attribute to the to the Canvas and choose scatter chart from the options. Visualizer creates a scatter chart using the Store Type attribute as the style of the shape.

The Legend has an Include/Exclude switch to show or hide labels in the visualization.

When a Legend gets large it hides some of the items. To see hidden items click the  icon.
icon.
