Adding a percentage column for a measure in Visualizer reports
Visualizer can automatically calculate percentages and create a percentage column for a measure.
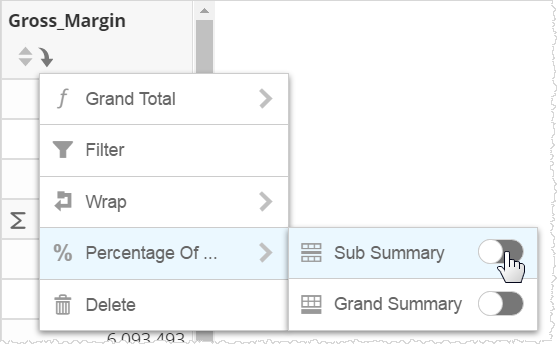
Note: The menu settings or must be toggled On when using a percentage column.
To add a percentage column, click the icon in the measure column header and select either the grand summary or, if available, sub-summary.
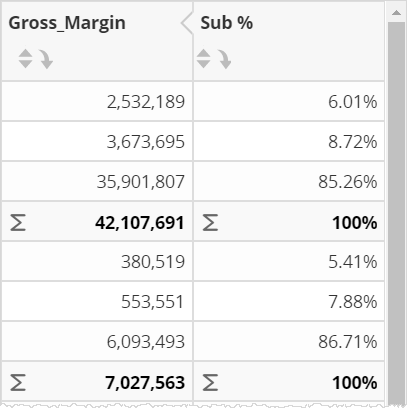
After this selection, Visualizer adds a new percentage column next to the measure.