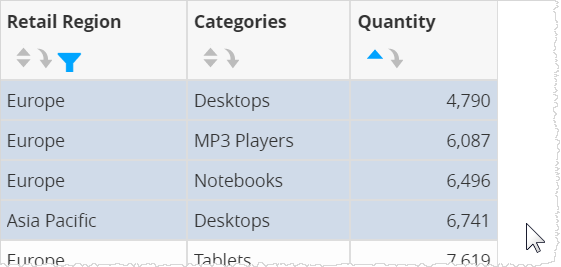
Filtering column data in Visualizer reports
- To filter a column click the Column menu
 icon in the column header and select Filter.
The Filter properties for the column display in the left panel.
icon in the column header and select Filter.
The Filter properties for the column display in the left panel.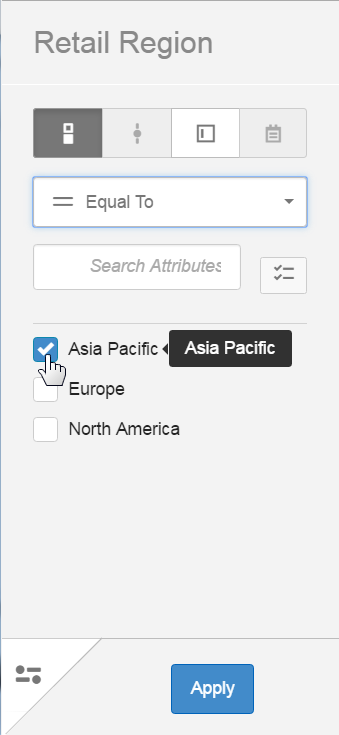
- The menu has a display filter switch. By default, the table filter is applied on the database. Switch this On to apply the filter on the data in memory.
- ClickApply to see the filter applied to the table.
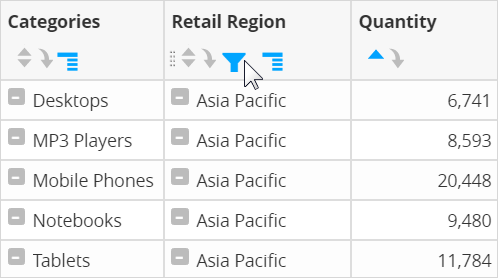
To change the filter, click the Filter icon in the column header and then drag-select a set of rows to instantly filter a table.
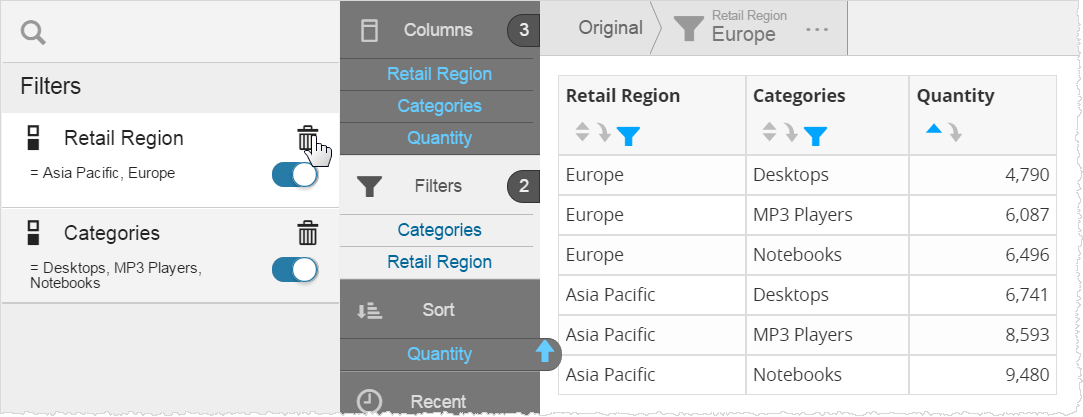
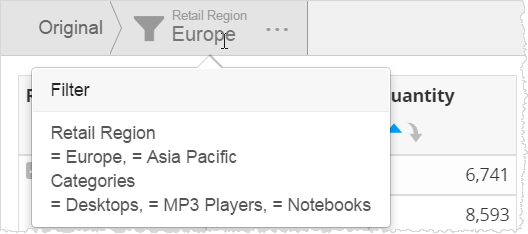
The filters that have been applied in the filter drill path are at the top. Hover to see the filters applied, and click on a node to go to a previous state.
To switch a filter Off or delete it altogether, click Filters on the left panel in the Chart Builder.