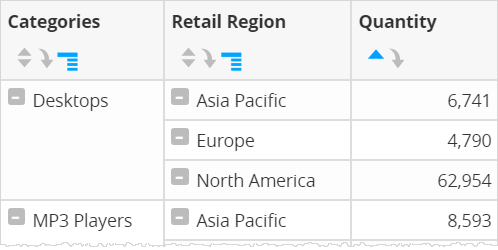
Grouping rows based on attributes in Visualizer reports (break by)
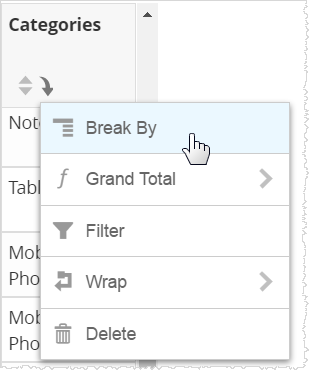
To group the table rows based on attributes and view summaries for each group in a column, click the Column menu icon  in the column header and select Break By.
in the column header and select Break By.
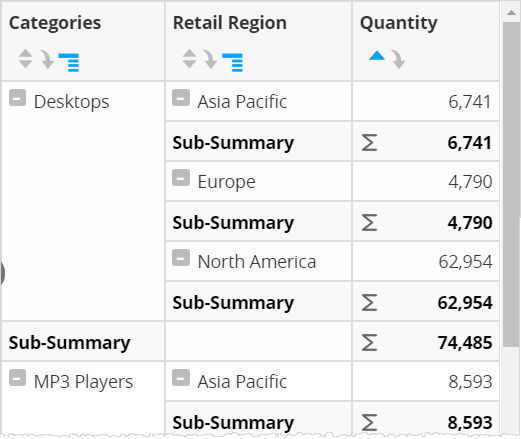
adds expand/collapse button and sub-summaries for each break. Click the hash mark by the category to collapse or expand the results in the table.
In order to see a sub-summary, your report must include at least one Measure column.
If you do not want to see any sub-summaries, you can turn them off using the setting.