Creating a report with data
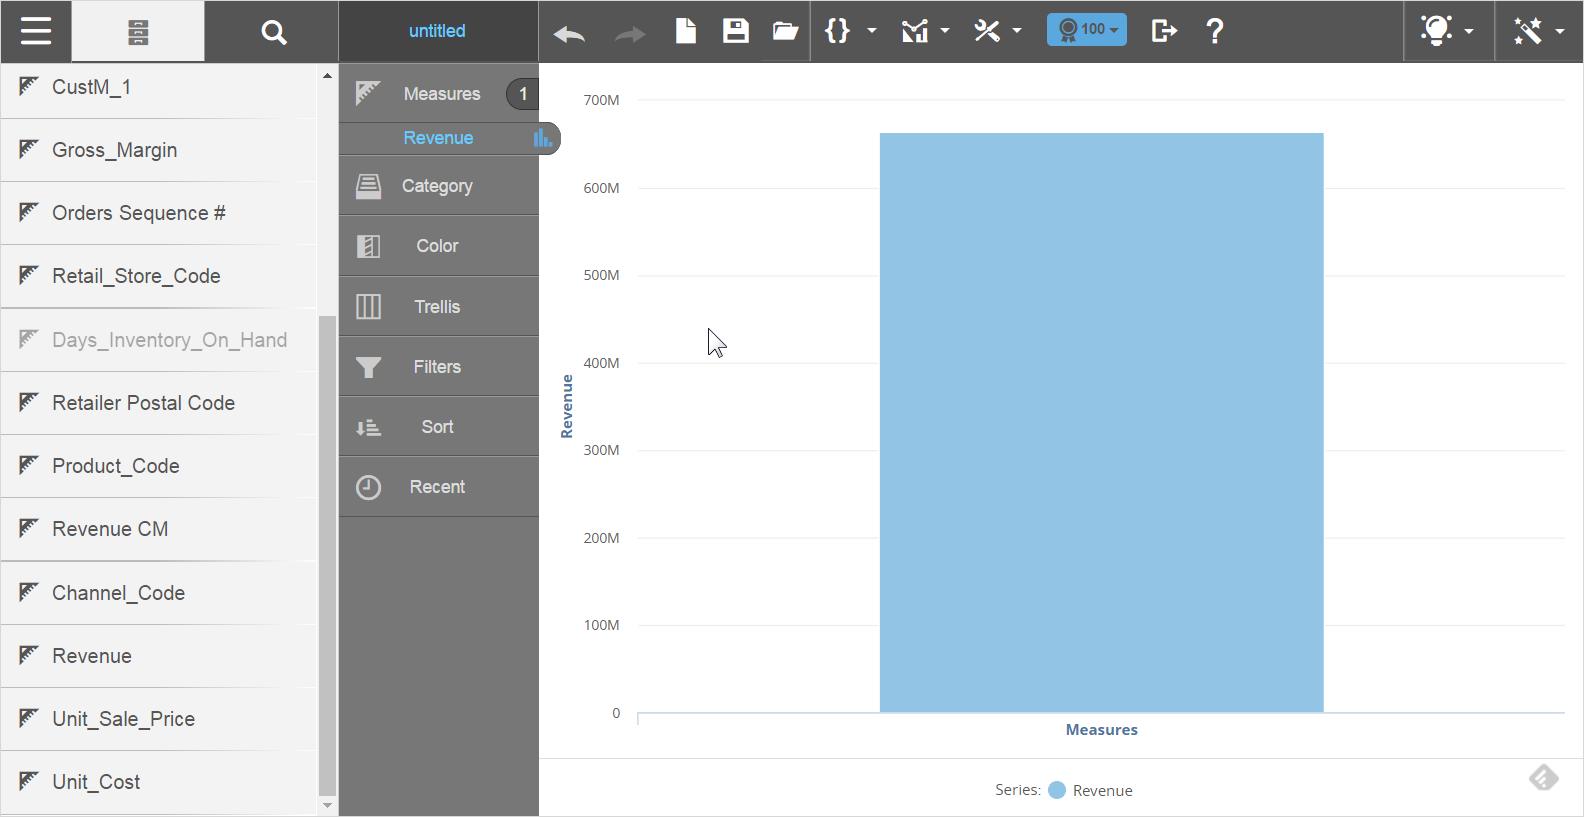
When you are familiar with your data, use Search to quickly find the columns to build your report. When you are not familiar with the columns available in your data, browse the measures and attributes in the Subject Area to see them.
Note: You can rest your cursor over a column with a long name to fully display the column name. If a column name is longer than two line paths, the column name is cut off with "..." and is not fully displayed.
Best Practice: Start with a measure.
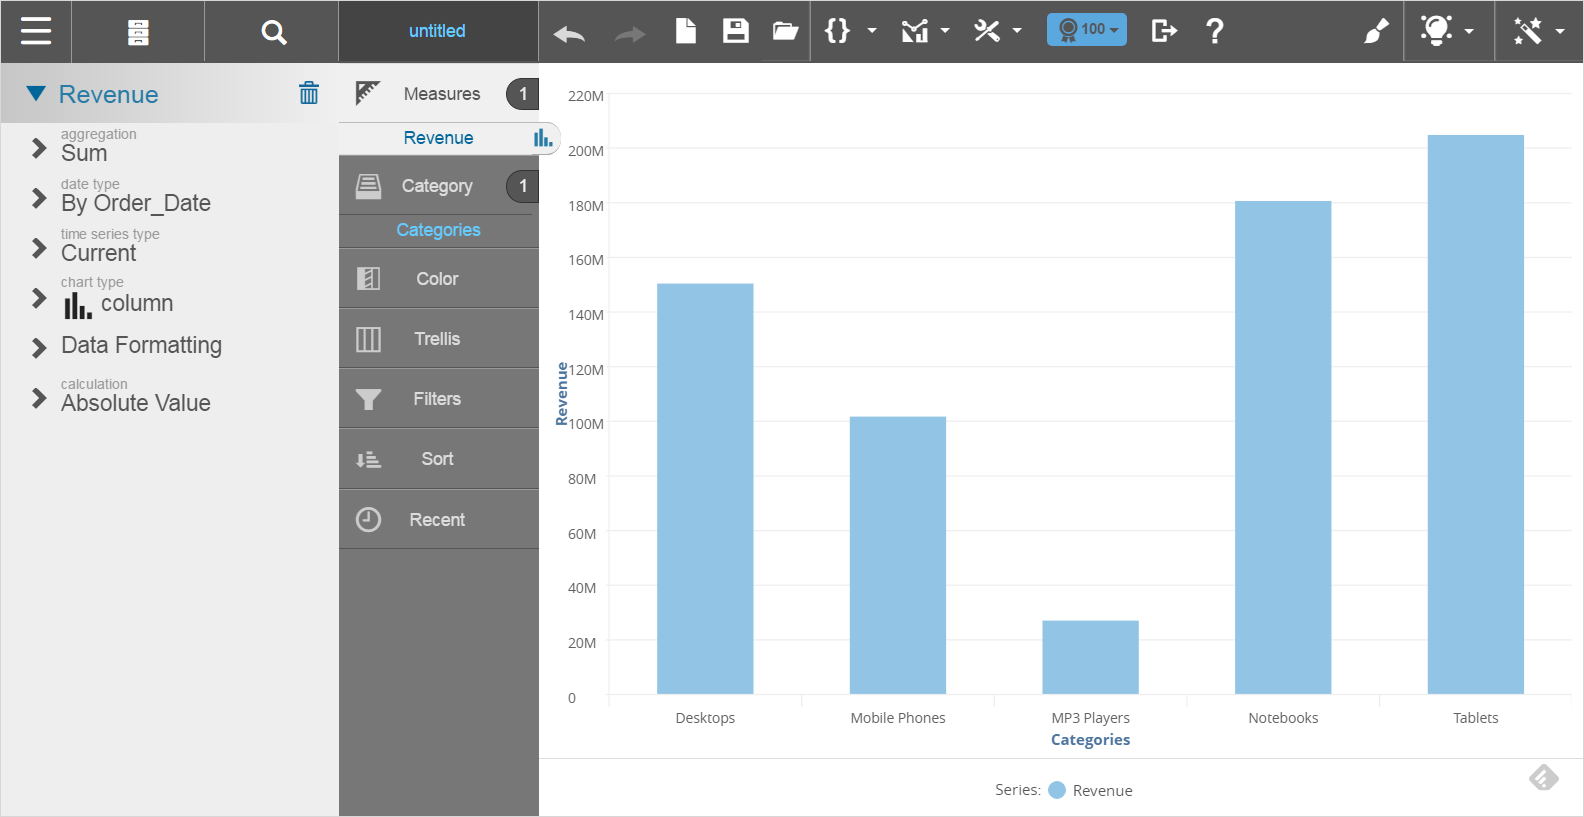
To create a report starting with data:
Note: Here are some guidelines for creating a report with data:
- At any time if you want to clear the current report and start over, clickCreate a New Chart (which is located to the left of the button).
- You can drag a column from one section (also called a "bucket") in Chart Builder to another, such as when you want to filter or sort on a column.
- To delete a measure or attribute, drag the name of the measure or attribute from the Chart Builder to the Subject Area and drop it on the Trash.
- Click on items in the legend to hide or show objects in the visualization. Click the legend icon if you want to show only the selected item (and hide everything else in the visualization). Click the name in the legend to show everything except the selected item.
- Visualizer has a 50,000 row limit for tabular data and 2,000 points/rows for chart data.
 on the tab next to the measure.
