Display report on a website and dashboard, dashboard tutorial
Dashboards are how you display and distribute one or more of the charts or tables you create in Visualizer. For this scenario, the manager wants to share the dashboard with the home office via an email.
Navigate to Dashboards.
Specify a name for the new Dashboard, then click .
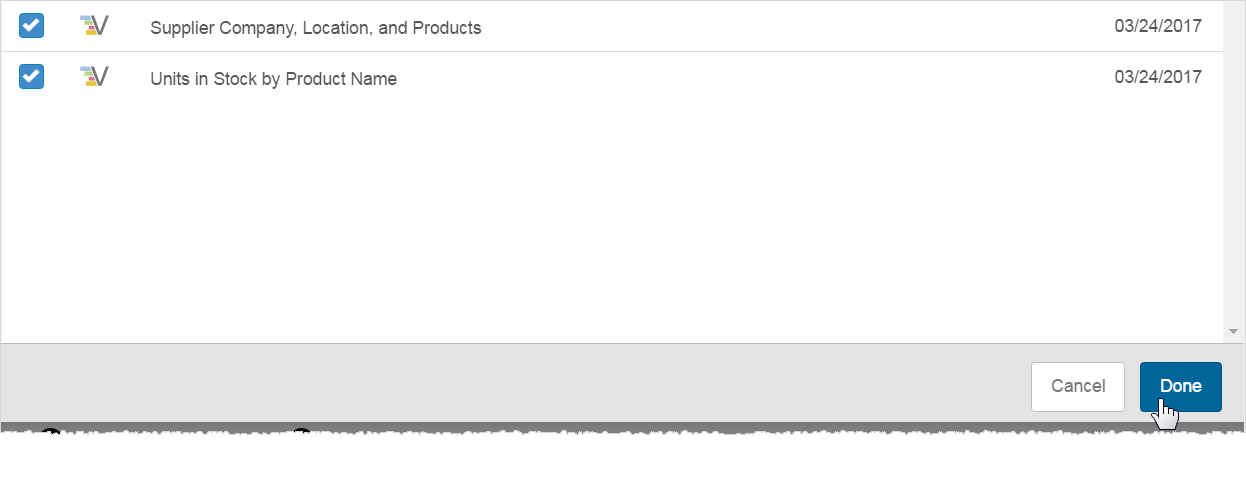
Click the center image to go to the reports list and select reports to put on the dashboard, and then click .
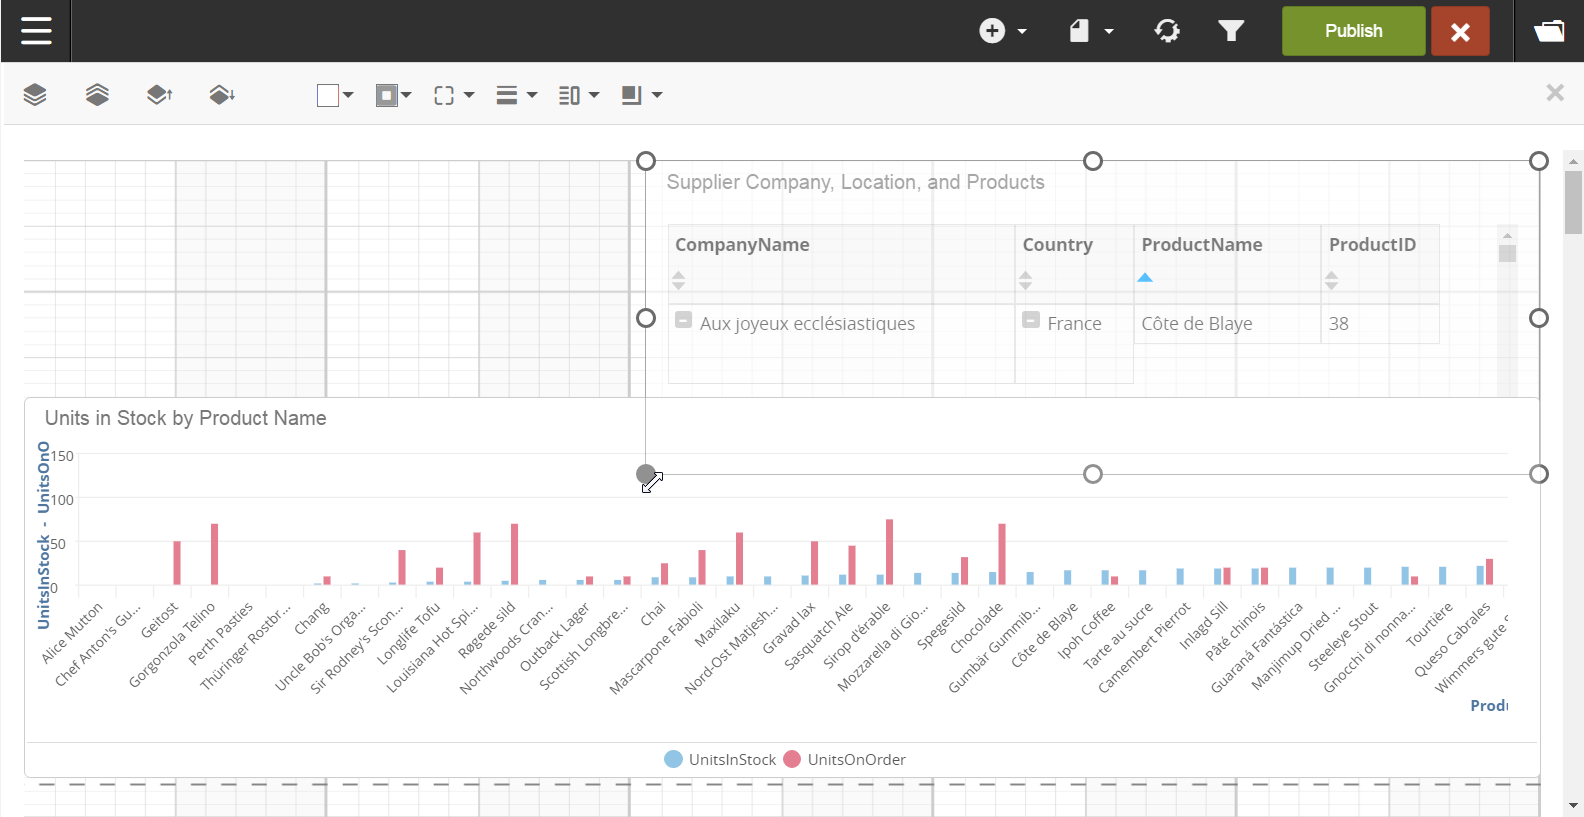
The reports you selected are added to the dashboard. You can resize and the reports around the space.
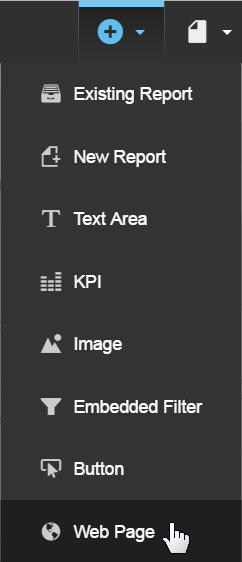
A feature of Dashboards is the ability to embed websites. As long as a website allows itself to be embedded, you can add clicking the menu and selecting Web Page.
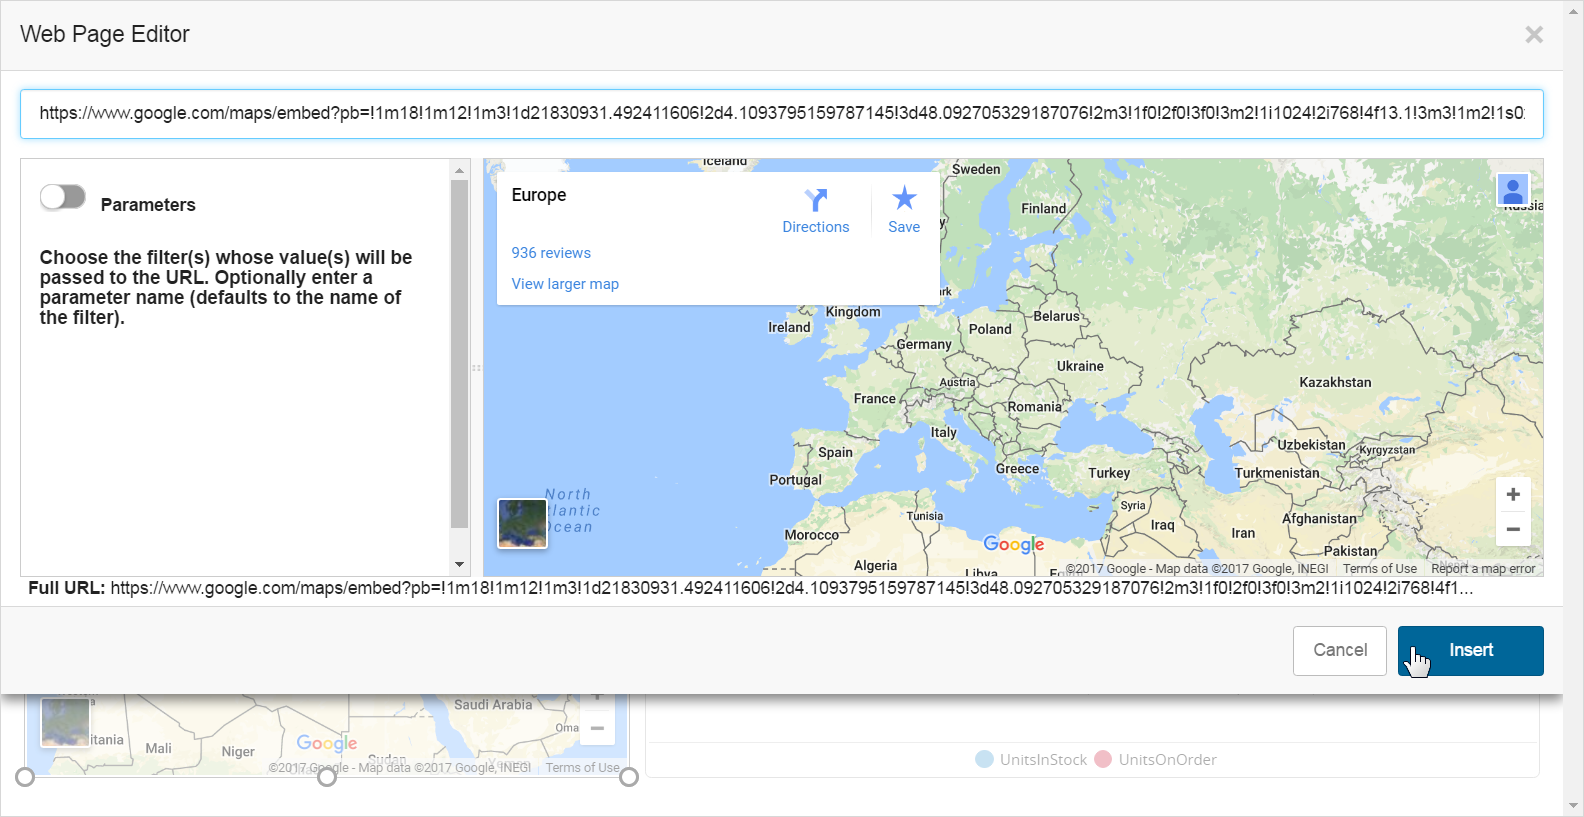
Insert a public URL. In this example, use Google Maps to find Europe, and select the embed option.
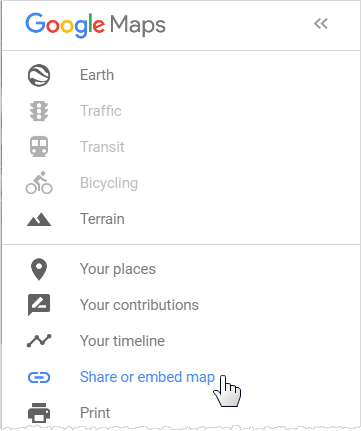
Strip the <iframe> tags from the URL and paste it into the Web Page Editor, and click Insert.
Resize the reports if needed. Then click .
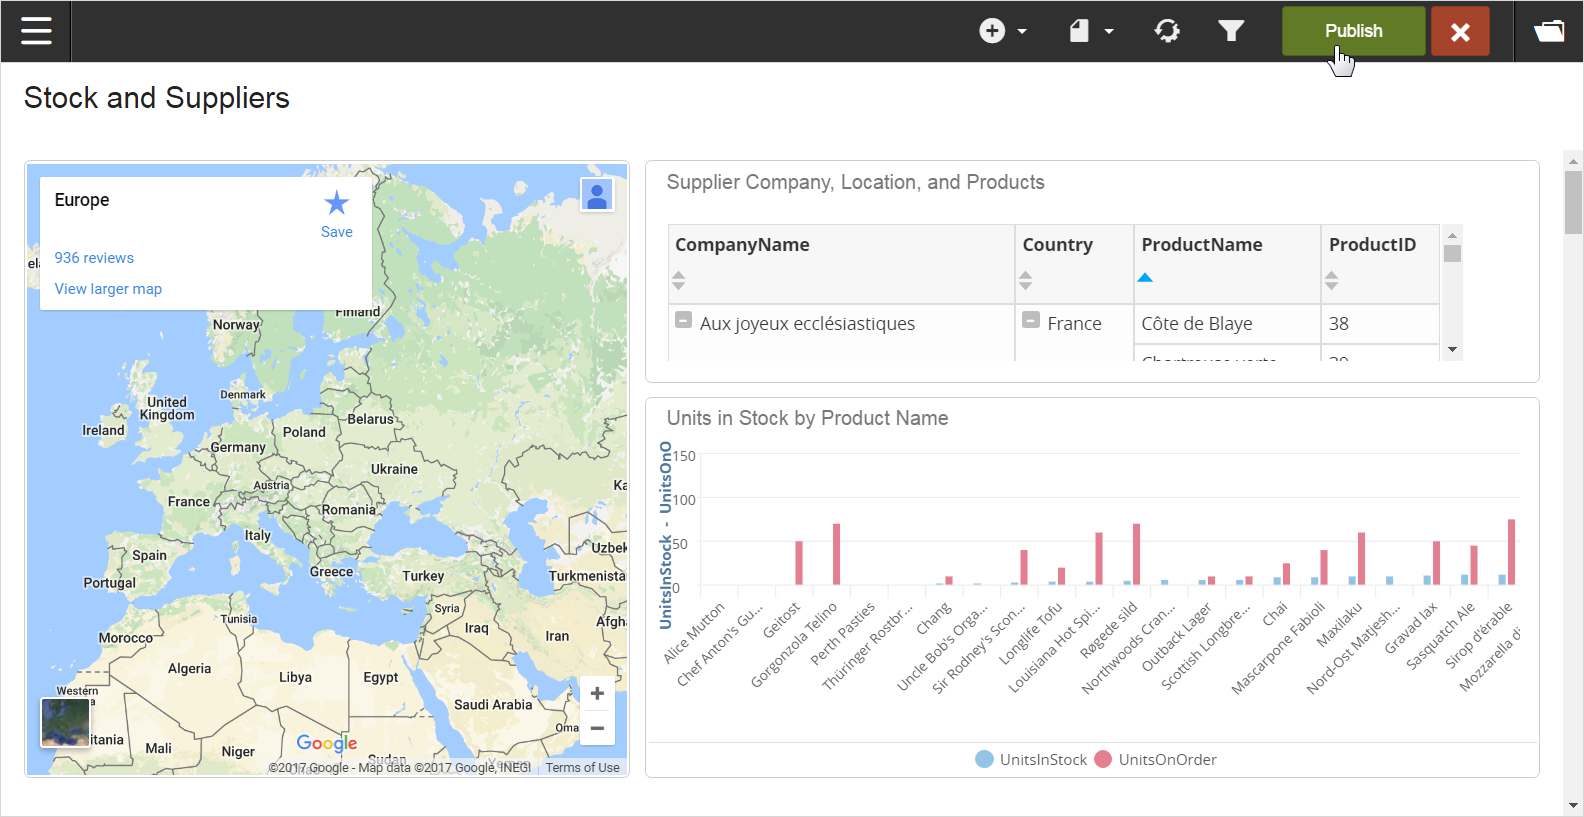
When a dashboard is published, users can scroll through the table and chart, and use the map as usual.
This is a very simple example of a map using a web URL; a more advanced Visualizer feature called Geomaps lets you set up the view to automatically navigate to particular places on the map.
There are many more types of content you can add to a dashboard, such as Key Performance Indicators, and images. Helpful features such as drill-down and filters can enhance the analysis experience.