Merge columns from multiple spreadsheets to a prepared source, dashboard tutorial
In this scenario, the manager wants charts that show information from three different tables. Since the tables are not complicated and don't require advanced processing, you can accomplish this using the Merge transform to put all the tables together into one.
The next step uses the Merge transform in Modeler Prepare.
In the new prepared source, click in the pipeline.
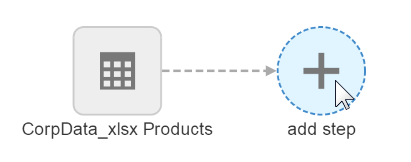
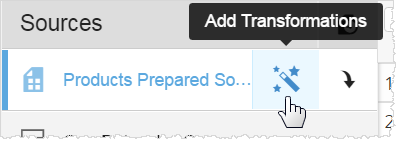
Next to the prepared source name, click .
Select the Merge transform.
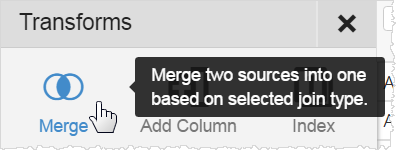
The Merge window is displayed.
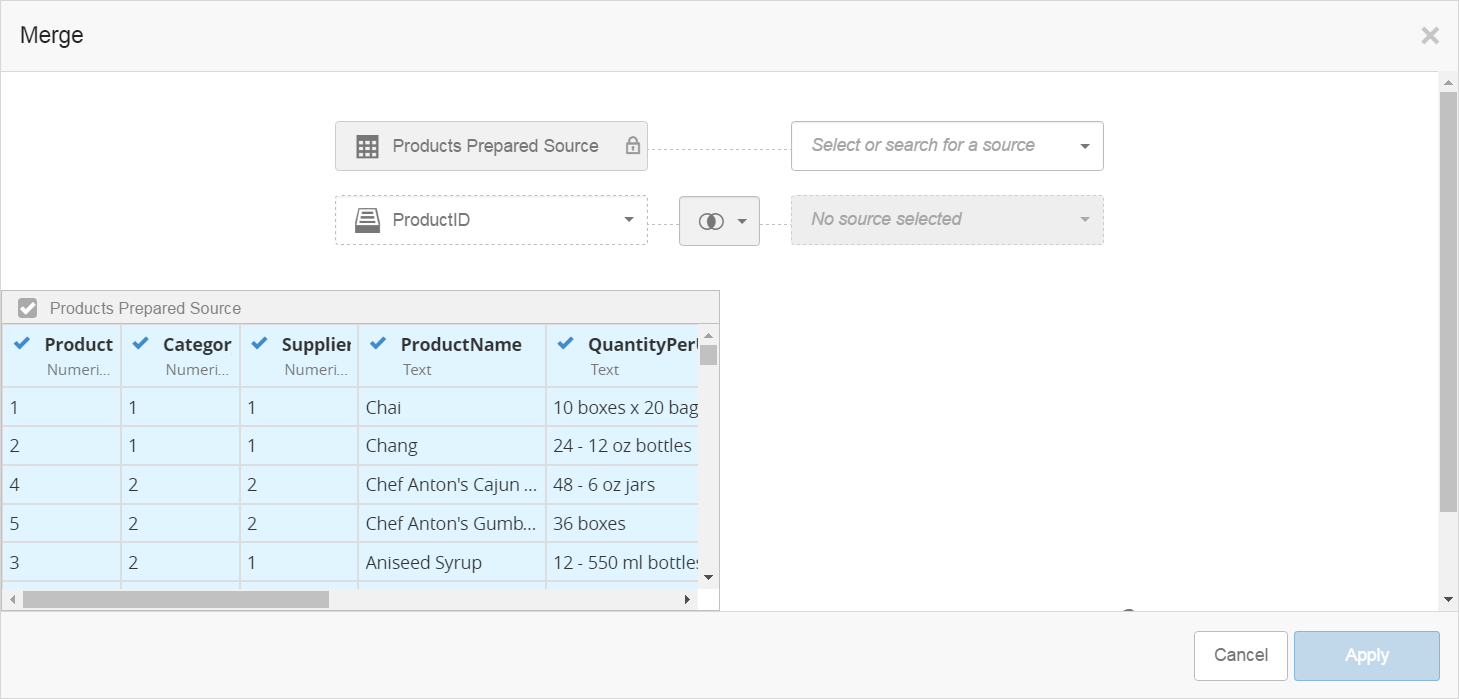
From the pulldown, select the CorpData_xlsx Suppliers table (the raw source).
To create a merge and to verify that the rows and columns are in the correct organization, a shared or key column needs to be identified. This is called a "join column". The column titles don't have to exactly match, but the data should be very much the same.
In this example, both tables used the same SupplierID keys, so you select them from the list.

Keys are meant to be unique, so if two spreadsheets use the same keys, they can be merged together in a logical way. It is important that at least one of the two columns has only one row for each unique key, otherwise the data may not match up correctly.
In this scenario, it makes sense that the Supplier table has a unique key, in a unique row for each supplier. Also the Products table can have the same SupplierID in multiple rows because one supplier may provide multiple products.
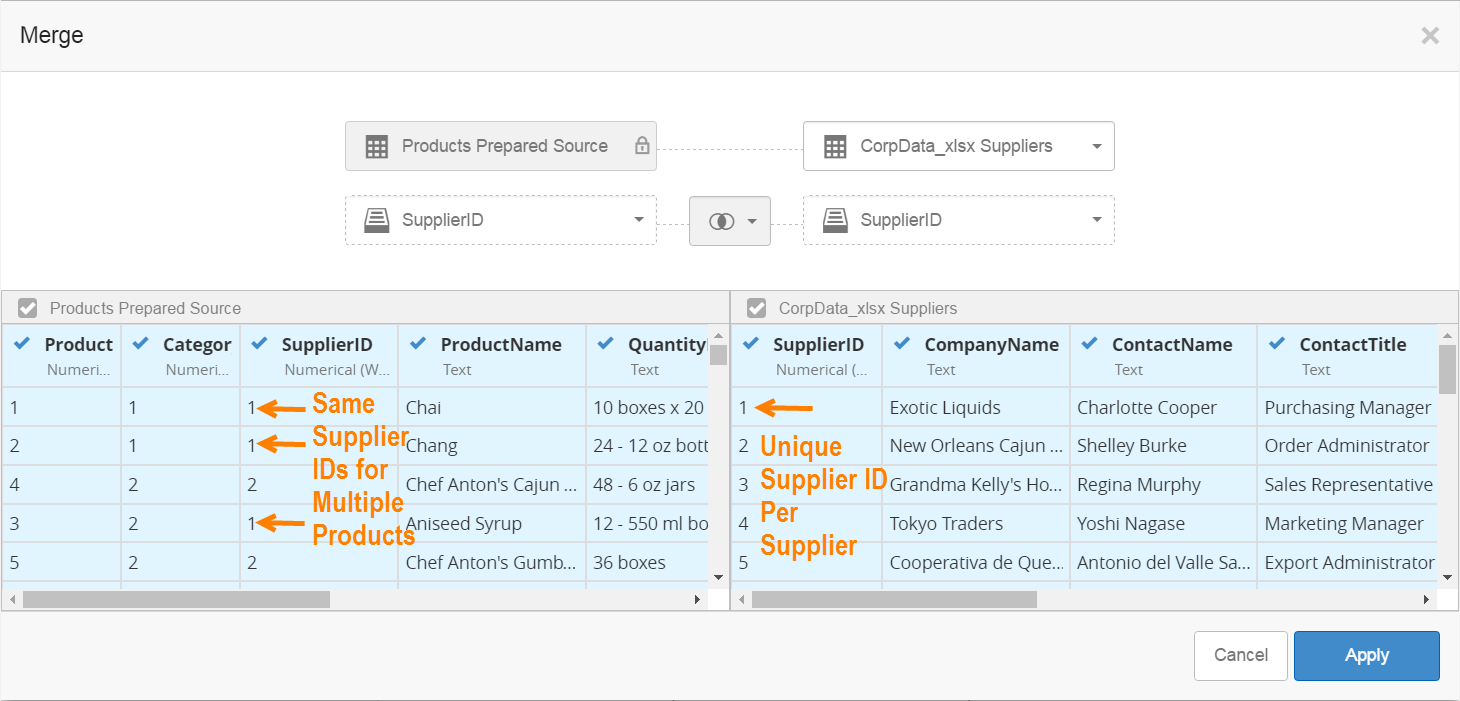
To make sure that the new rows are aligned correctly, you specify a join. Joins have different types. Part of deciding how to use the join depends on what rows the final prepared source should contain. For this example, the default inner join will match the rows between the left and right tables, and return only the ones that contain the same SupplierID in both columns.
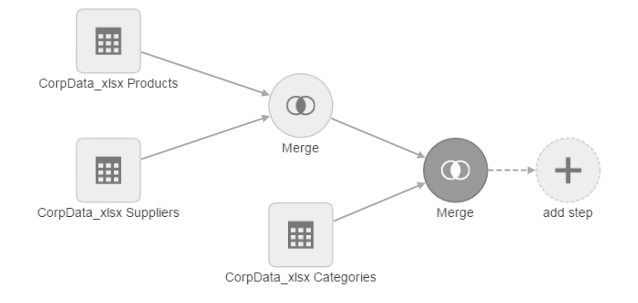
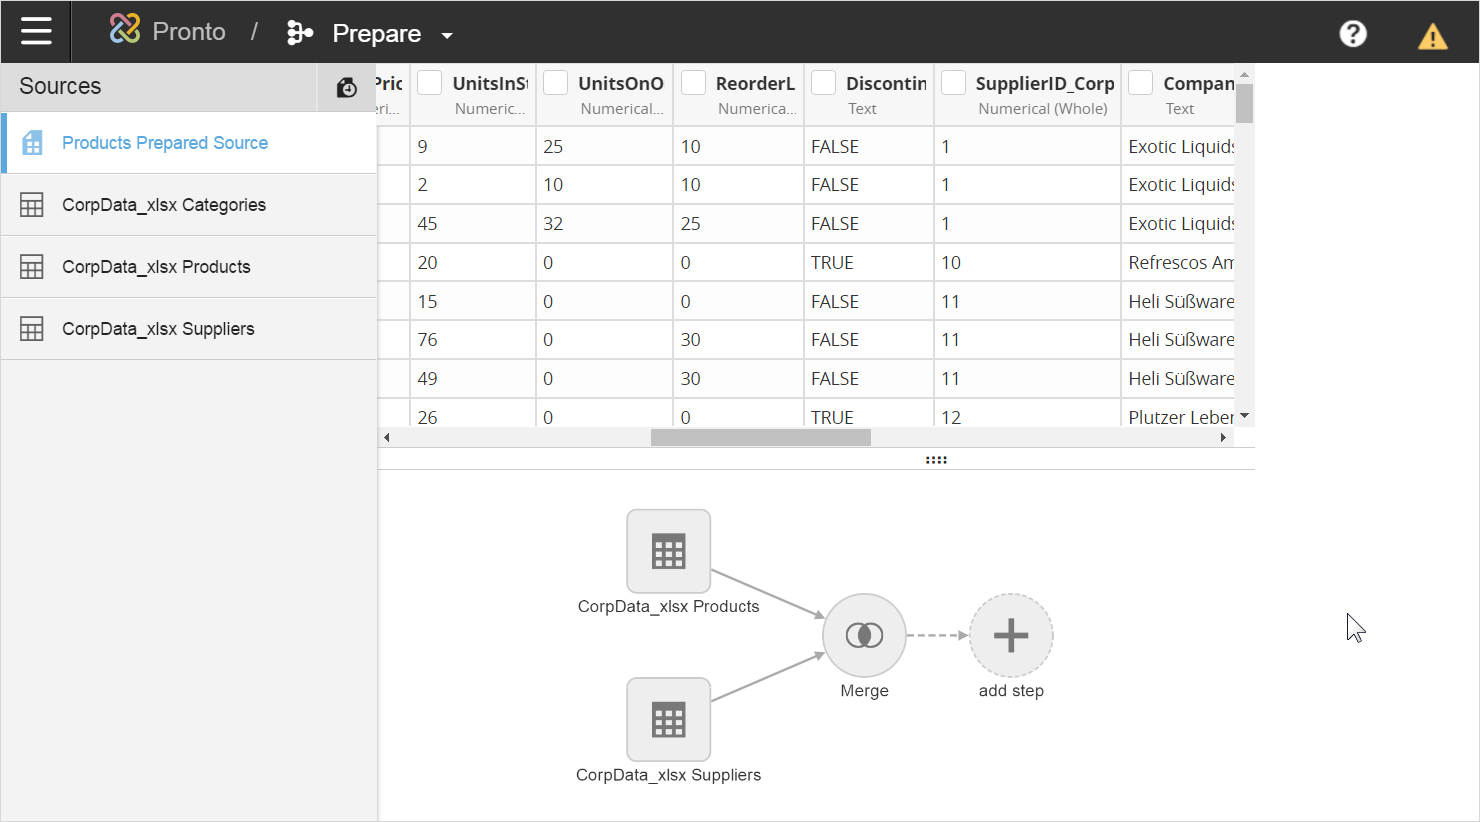
Now the merge is defined. Click . Modeler compares the two tables and merges them based on the join. It returns the results, in this case all the Products, augmented by all of the Suppliers columns for each product. Modeler also shows the merge step in the pipeline below the data.
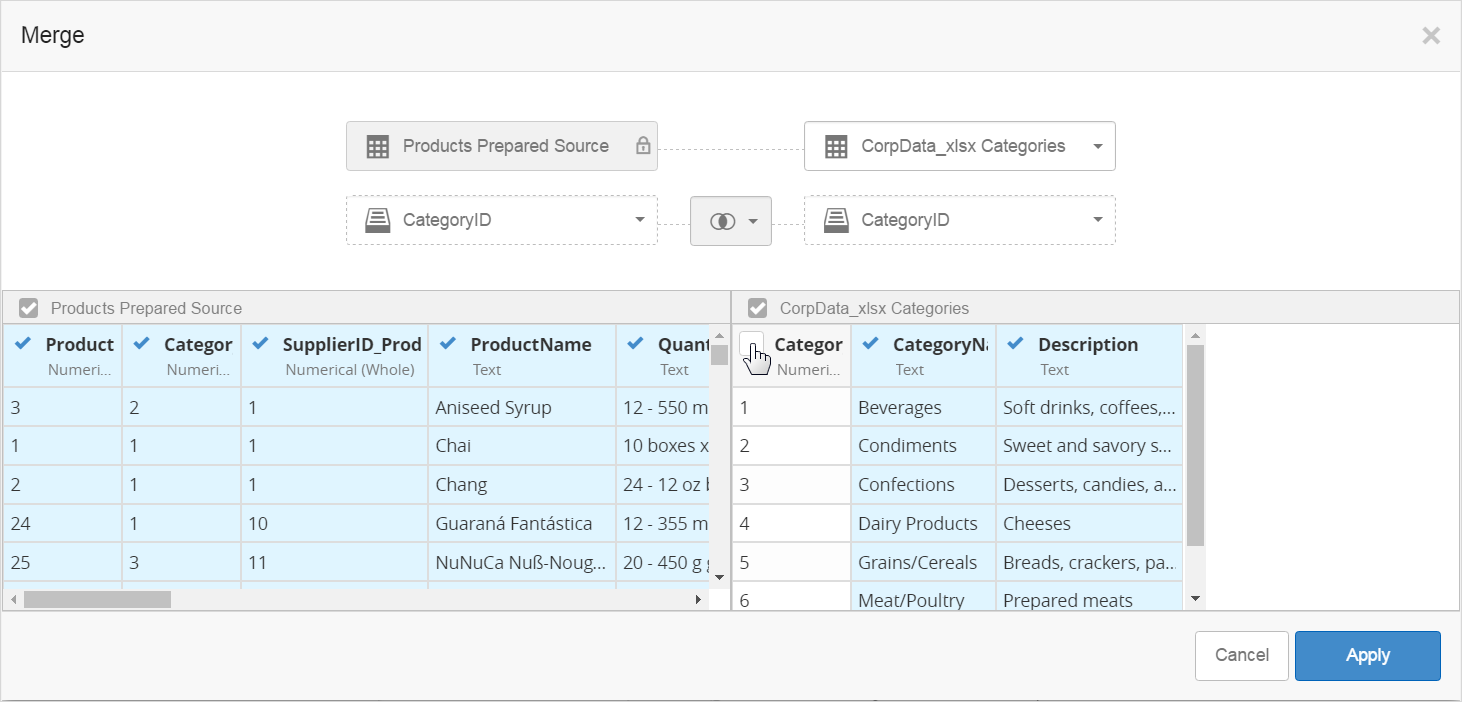
Next repeat the merge process, this time with the CorpData_xls Categories as the second source. This time, for something new, notice that you can uncheck the CategoryID column in the second source, so that it does not show up in the resulting table. Modeler still uses the column to perform the join, it does not display what is essentially the same data twice.
When you click , the pipeline looks like this:
