Can I change the columns that are shown in a chart on Android?
If a report has been set up for it, you can pick different data to show. For example, a report shows Quantity by Category, you can change it to show Quantity by Country. This feature is called a column selector.
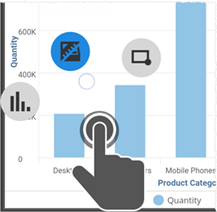
Press on a chart to show its chart menu bubbles.

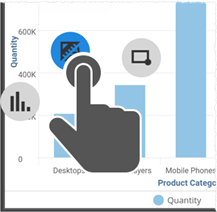
Keep pressing and slide to select the menu.

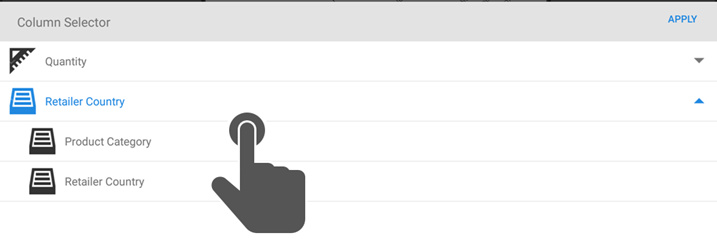
Tap the expand and collapse icons to show the available options. Tap to select another column.

The chart is updated with the new data.