Chart display styles
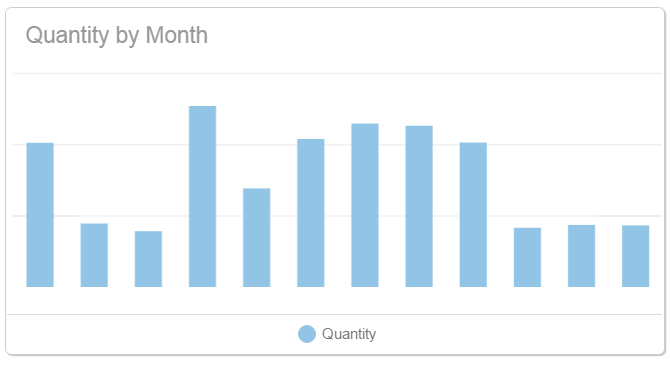
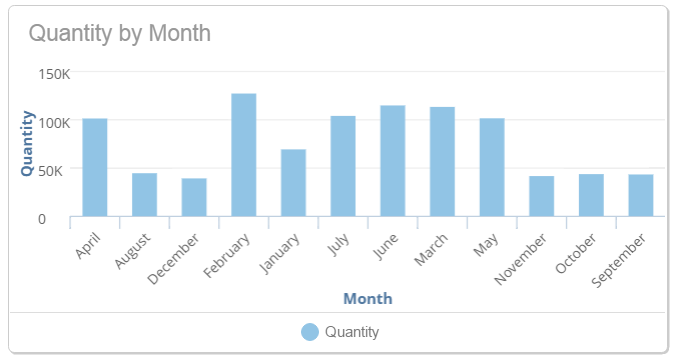
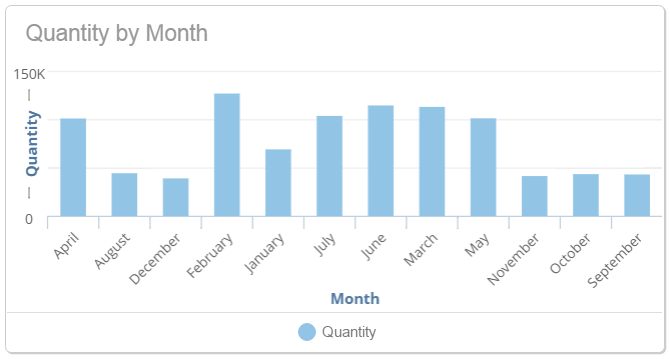
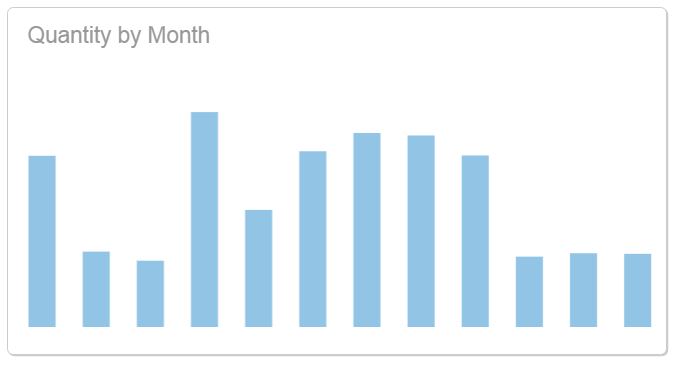
Chart Display styles are a way to change the formatting of Visualizer charts, at the individual dashlet level. Element styles affect the way axis, legends, and tick marks are displayed or not displayed.
Display styles include:
- Standard
- The chart displays as it was designed in Visualizer. This is the default setting.
- Reduced
- The y-axis is compressed.

- Minimal
- Axis, legends, and tick marks are not displayed.


