Introduction to BQL
The Birst Logical Query Language (BQL) is a fundamental feature of Birst. By understanding and using this language, advanced data modelers and report authors can get the most out of the application.
Before learning BQL
It helps to have a basic understanding of databases, data warehouses (including dimensional modeling), as well as business analysis and reporting. This topic discusses BQL functionality and query architecture, and shows where in the product you can use BQL to create powerful reports. Subsequent topics go into more detail about the basic syntax, and delve into the most powerful aspects of the language.
About BQL
BQL is a powerful logical query language that supports important capabilities in Birst including:
- Filters and KPIs
- Queries, conditional formatting, and custom calculations for measures in Visualizer and Designer reports
- Shared (saved) expressions used in visualizations
- Managed variables for a space
- Custom attributes and measures creating columns without a Scripted Source
- ETL (Scripted Source) scripts
BQL versus SQL Syntax
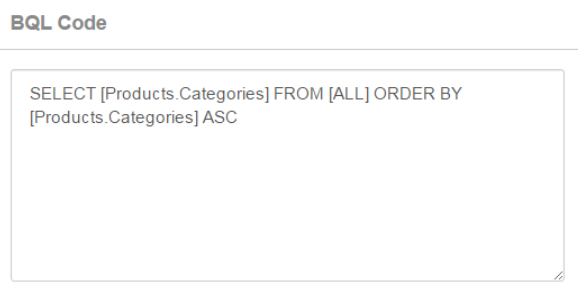
BQL is a logical query language that supports the logical data model based on a star schema (dimensional modeling). BQL is translated through the Birst engine to create the appropriate database platform physical SQL statement. SQL supports a relational schema. BQL syntax is very similar to SQL, so it may appear familiar to you, however it has important differences. For example, consider this basic BQL statement and its results:
SELECT [Order_Date: Sum: Quantity], [Products.Products] FROM [ALL] WHERE [Order_Date: Sum: Quantity]>=50000 ORDER BY [Order_Date: Sum: Quantity] DESCENDING
| Order_Date: Sum: Quantity | Products |
|---|---|
| 105,703 | mangoPhone 4G 32GB |
| 103,445 | mangoPad 3 32GB |
| 94,946 | mangoPad 3 64GB |
| 65,229 | mangoPhone 4G 64GB |
The BQL SELECT statement returns the quantity ordered for each product for quantities 50000 or over, sorted by quantity. [ALL] means to query across the full set of attributes (dimensions) and measures (facts) in the space. BQL uses [ALL] instead of a table name because the SELECT statement already specifies the dimension (Products) and the attribute (CategoryName). This is quite different than how SQL syntax would work in an RDBMS.
Queries and Where Calculations Occur
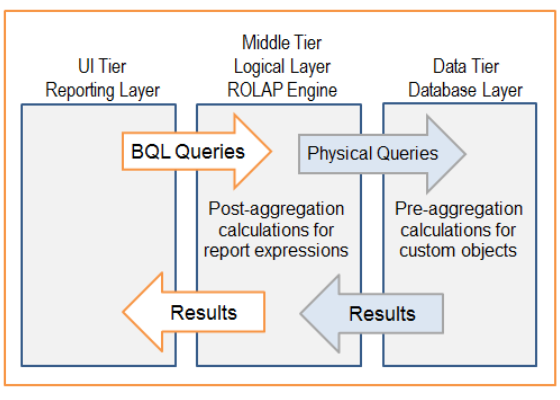
At a high level, this diagram shows that the Birst user interface sends BQL to the Birst middle tier from the logical layer. The middle tier executes the query logic. For some important scenarios, the middle tier passes the queries onto the data tier and processes those results. Then the middle tier returns the results to the user interface, to be rendered in reports and dashboards.

-
Queries executed in the middle tier for report expressions, variables, and ETL scripts
Report expressions and ETL scripts execute in the middle tier, in the Birst ROLAP engine. These are called "logical queries" or "post-aggregation queries". Post-aggregation means that calculations occur after the results are returned from the database in the logical layer (middle tier).
-
Queries executed in the data tier for custom measures and custom attributes
Custom measures and custom attributes are additions to the data model which are formulas calculated in the data tier called "physical queries or "pre-aggregation queries". Pre-aggregate queries used for custom measures and custom attributes have a slightly different BQL syntax than logical queries.
In some scenarios it is helpful to calculate report expressions in the data tier. This is also called "push-down expressions".
Using BQL to Customize Spaces
Birst spaces are containers for raw data acquired from sources (i.e., Infor Data Lake), the data model, visualizations, and dashboards. Custom objects defined for a data model are reusable across visualizations and dashboards. Space Administrators can create custom attributes, measures, and variables.
- Custom Attributes and Measures for the Data Model
- Space Administrators use BQL to create custom attributes and measures for the data model. These can be shared with any visualizations in the space. They are available in the Default Subject Area within Designer and Visualizer. Only columns within a data row of the same hierarchy or same measure can be referenced in the BQL.
Note: Custom attributes and measures use a slightly different syntax than BQL used in report expressions or ETL scripts.
- Managed Variables
- Space Administrators can use BQL to create Managed Variables at the space level for use in visualizations, Query Based Objects (Modeler/Connect), and Scripted Sources in the space. The BQL syntax for variables is the same for report expressions.
Using BQL in Dashboards and Reports
Visualizer, Designer, and Dashboards automate most of the BQL for you. Birst gives you more control over visualizations and dashboards by letting you write BQL for report expressions. Expressions can be used for key performance indicators (KPIs), filters, report-level attributes and measures, and conditional formatting.
- Dashboards
- Dashboards support expressions as key performance indicators (KPIs) and as an indicator expression for KPI indicator shape and color.

- You can use BQL expressions for sophisticated dashboard filters. See Dashboard filters in the Infor Birst Dashboards User Guide.

- Dashboards support expressions as key performance indicators (KPIs) and as an indicator expression for KPI indicator shape and color.
- Visualizer Reports
- The Visualizer Expression Builder helps you add report-level attributes, measures, or filters based on BQL expressions. These expressions can be available for other visualizations in the same space by enabling the Make Global setting.
- See Creating an Expression in Expression Builder in the Infor Birst Reports User Guide.

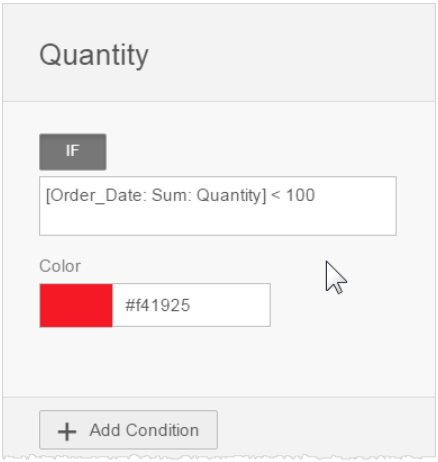
- For Visualizer tables you can use BQL expressions to specify conditional formatting. See Formatting tables and crosstabs using conditional statements in the Infor Birst Reports User Guide.
 Note: To see the BQL generated by Visualizer when you drag-drop attributes and measures onto the work area, click . You can try queries in Space Management/Query Admin, then copy and paste the validated syntax into your expressions.
Example query:
SELECT TOP 100 USING OUTER JOIN [Order_Date: Sum:Quantity]'COL0', {Products Categories]'COL2' FROM [ALL] - Designer Reports
- Designer has an Expression Builder for adding report expressions. You can save an expression, called a Saved Expression, for use in other visualizations in the same space. Use Report Expressions to define report-level attributes or measures and custom calculations based on one or more base measures and add them to a Subject Area. These are different than space-level custom attributes or measures. See Expression Builder in the Infor Birst Reports User Guide.
- Use BQL also for Designer report-level conditional formatting based on expressions. See Displaying conditionals in Designer in the Infor Birst Reports User Guide.
- BQL lets you pass filter (prompt) values to expressions through the GETPROMPTFILTER and GETPROMPTVALUE functions.
- Designer Expression Builder allows you to write scripts that support advanced data manipulation at the report level.
Note: To see the BQL generated by Designer when you drag-drop attributes and measures onto the report layout, click . You can try queries in Space Management/Query Admin, then copy and paste the validated syntax into your expressions,
Example Report Query:
SELECT USING OUTER JOIN[Products.Categories] 'F3',[Order_Date: Sum: Quantity] 'F1',[Order_Date: Sum: Revenue] 'F7' FROM [ALL]
Using BQL in ETL Scripts for Transforming Data
When source data is imported to Birst, it may need modifications (transformations) to correct or create additional data to map to the data model. Birst provides powerful scripting functions to facilitate this process. ETL Service (scripted sources) scripts transform, manipulate, and stage source data before being published to the data model. ETL scripts use a subset of BQL evaluated at the middle tier. To create scripted sources see Creating a Scripted Sources in the Infor Birst Modeler User Guide.