Line chart
A line chart shows data points that are connected by straight line segments. Use a line chart to show trends and changes over continuous intervals, such as time.
Line charts reveal patterns, rates of change, and the overall data direction, enabling identification of increases, decreases, and fluctuations across datasets.
Use line charts for:
- Time-based data analysis
- Performance tracking
- Comparative trend analysis across datasets
This graph shows an example of a line chart:
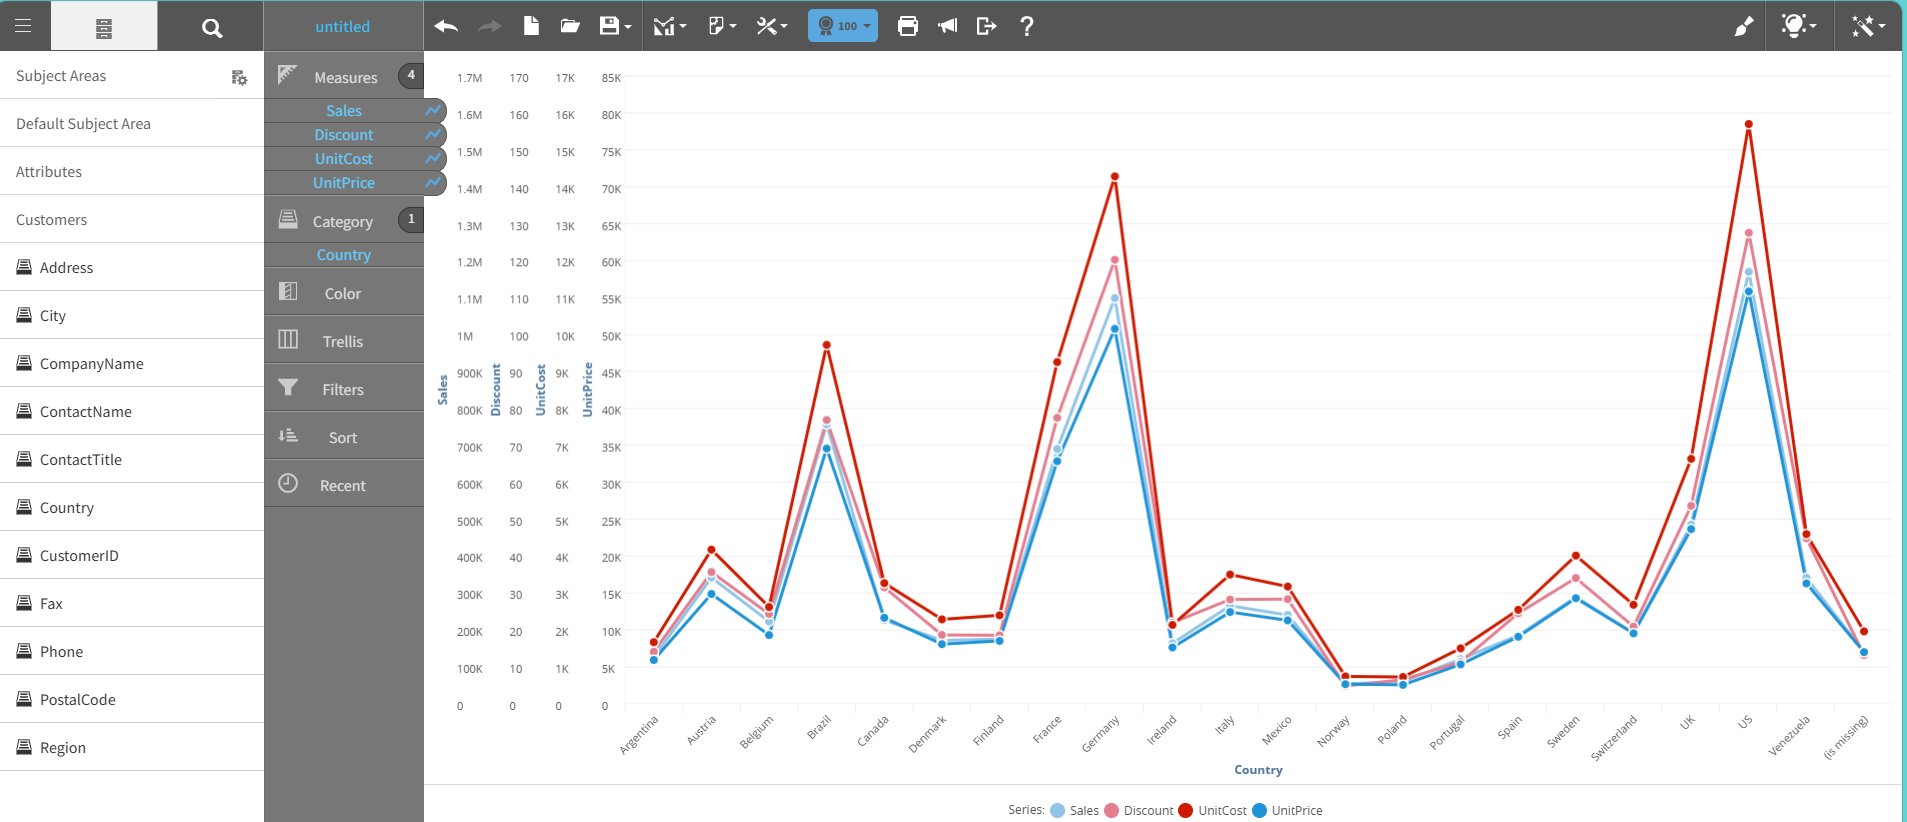
For details on how to create a line chart, see Creating a report by chart type.