Crosstab chart
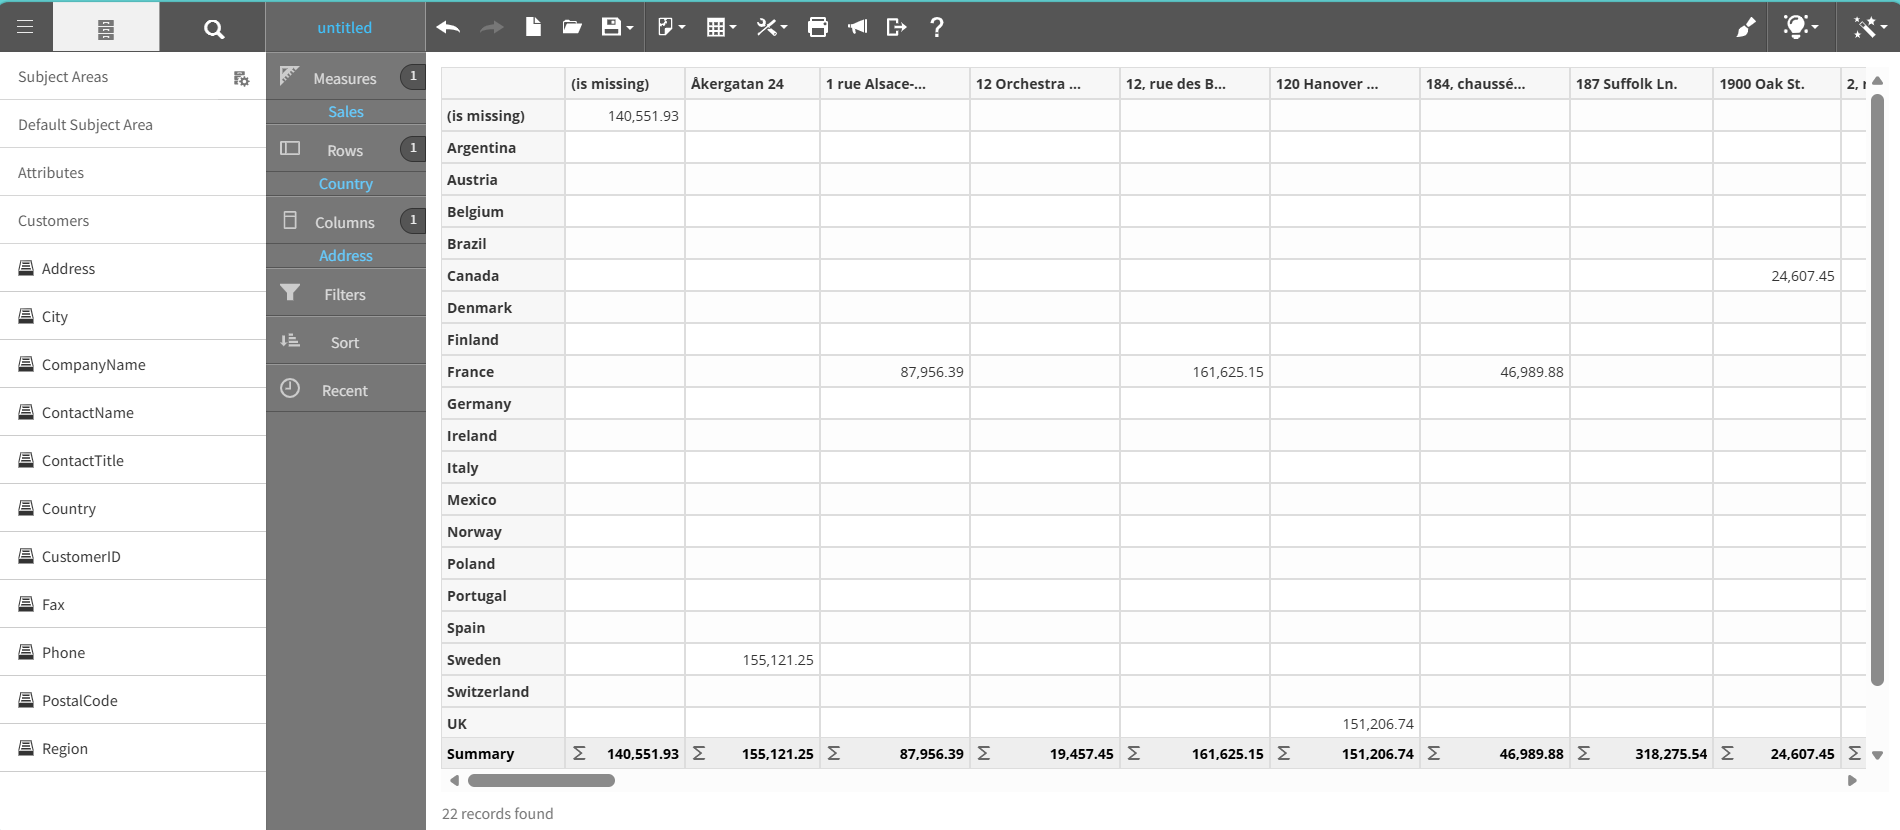
A crosstab or a pivot table presents summarized data in a matrix of row and column headers, enabling analysis of relationships between dimensions and measures.
A crosstab supports subtotals, grand totals, and conditional formatting for multi-dimensional data comparison.
This graph shows an example of a crosstab chart:
For details on how to create a crosstab chart, see Creating a report by chart type.