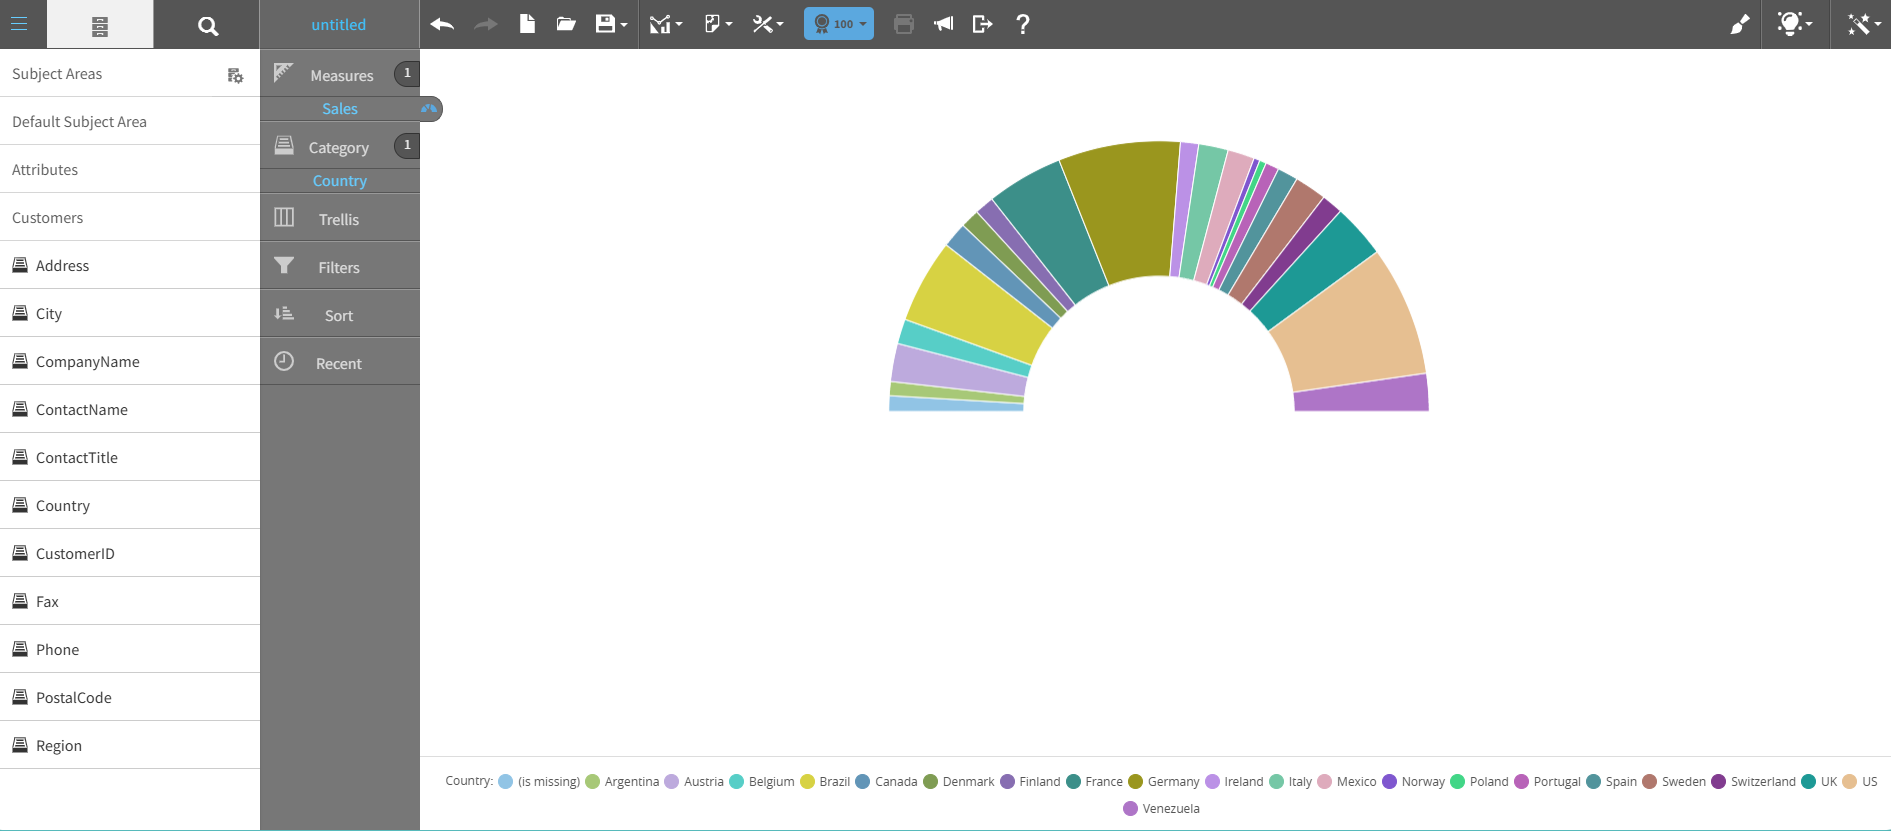
Semi-donut chart
A semi-donut chart is a half-circle chart that represents proportional data in a gauge-like format.
Use a semi-donut chart to visualize:
- Progress toward a goal
- KPI performance
- Partial completion metrics
This graph shows an example of a semi-donut chart:
For details on how to create a semi-donut chart, see Creating a report by chart type.