Table chart
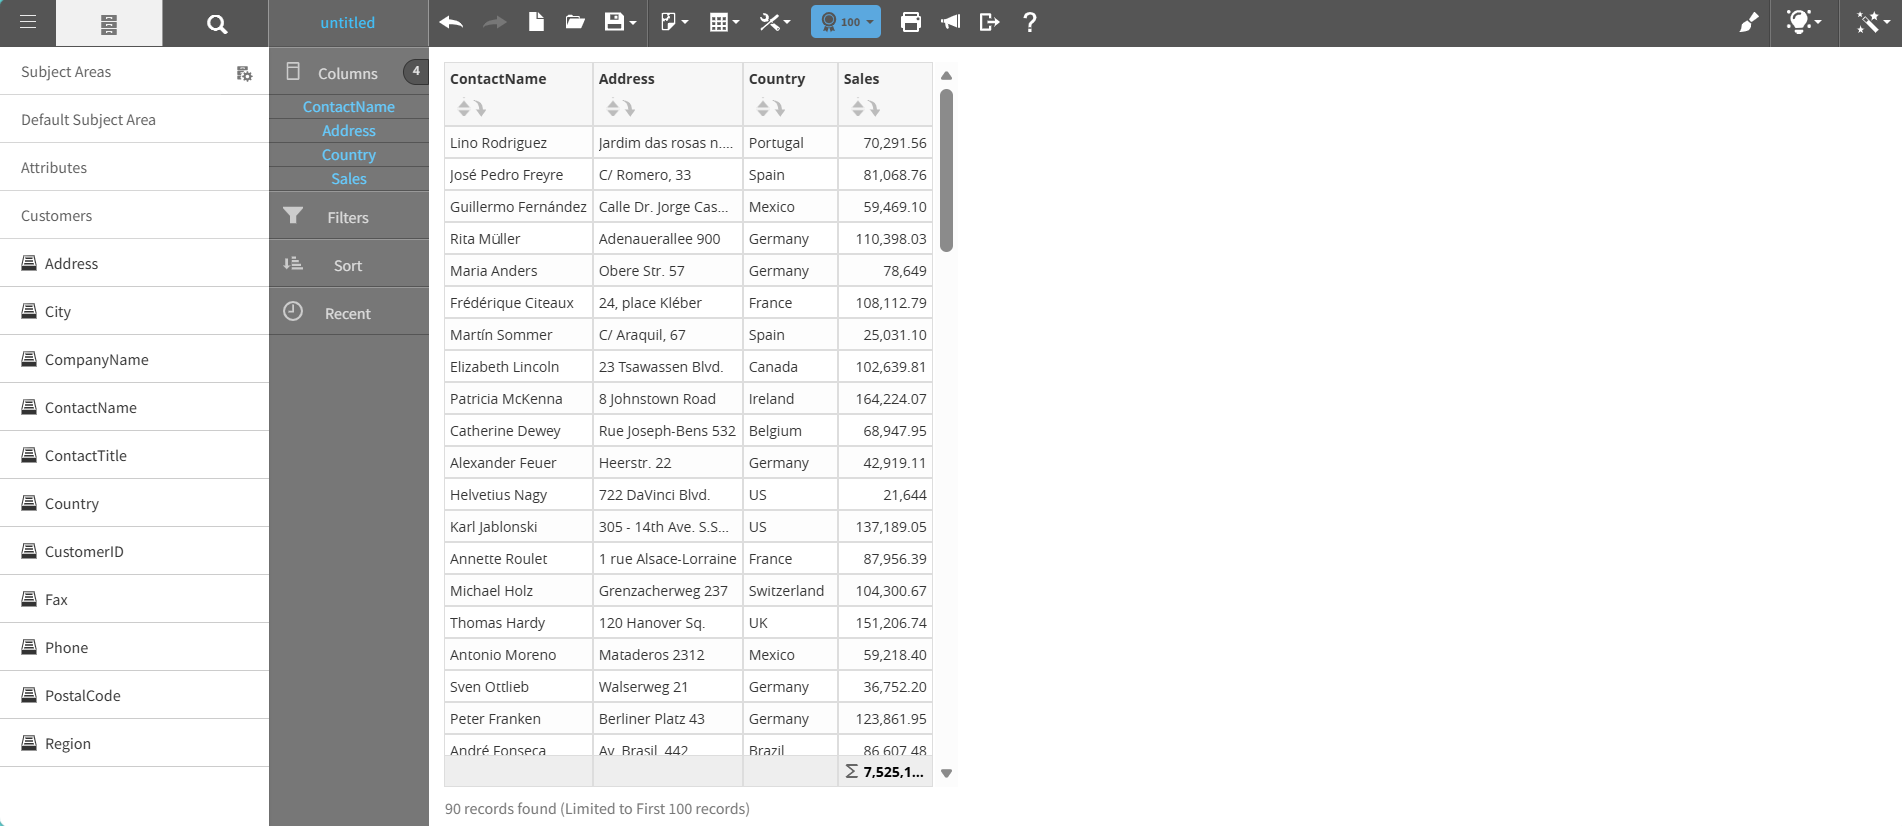
A table chart shows data in a structured grid of rows and columns, enabling precise value and detailed view.
Use a table chart to:
- Review exact numeric values.
- Analyze data at the record level.
- Drill down to detailed data sets.
Tables support sorting, filtering, conditional formatting, and pagination for efficient data organization and exploration.
This graph shows an example of a table chart:
For details on how to create a table chart, see Creating a report by chart type.