Height funnel chart
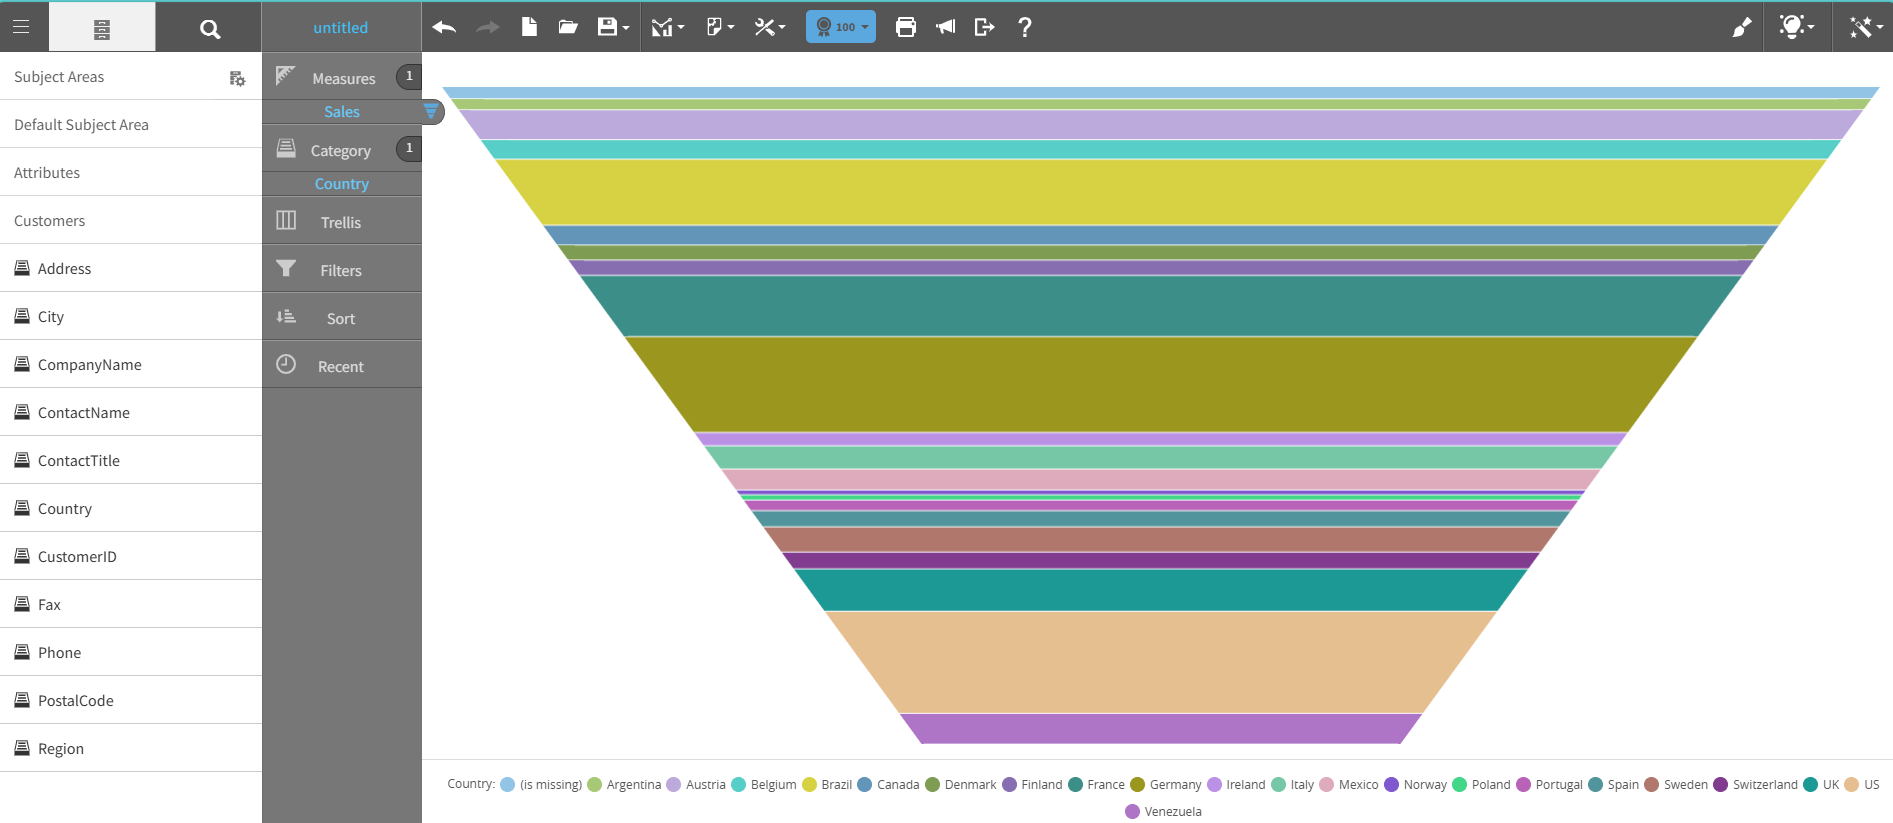
A height funnel chart shows data as a series of stacked horizontal sections that decrease from top to bottom. The height of each section represents a section's value.
Use a height funnel chart to visualize:
- Process stages, for example, sales pipelines or conversion funnels
- Workflow progression, for example, recruitment or onboarding
- Drop-offs or reductions between sequential steps
This graph shows an example of a height funnel chart:
For details on how to create a height funnel chart, see Creating a report by chart type.