Bar chart
Bar charts show data as horizontal bars. The bar length represents the value magnitude.
Bar charts are suitable for categories with long labels or large category sets. The horizontal layout accommodates text labels effectively.
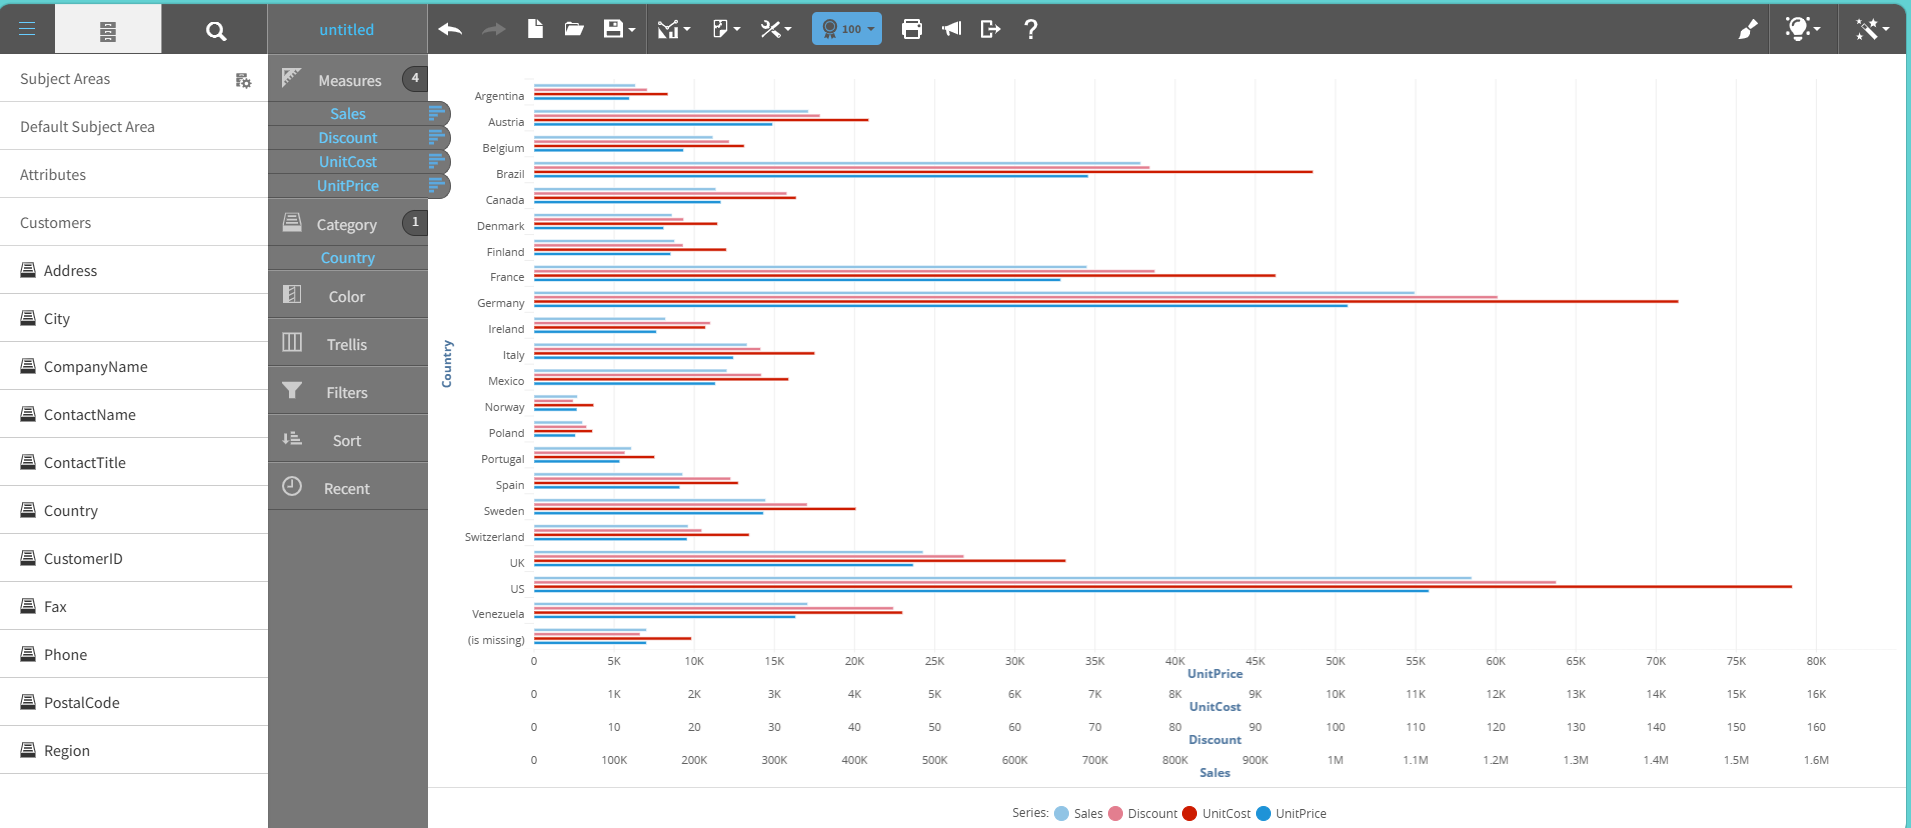
Bar charts support grouped and stacked formats to enable comparison across multiple data series.
This graph shows an example of a bar chart:
For details on how to create a bar chart, see Creating a report by chart type.