Areaspline chart
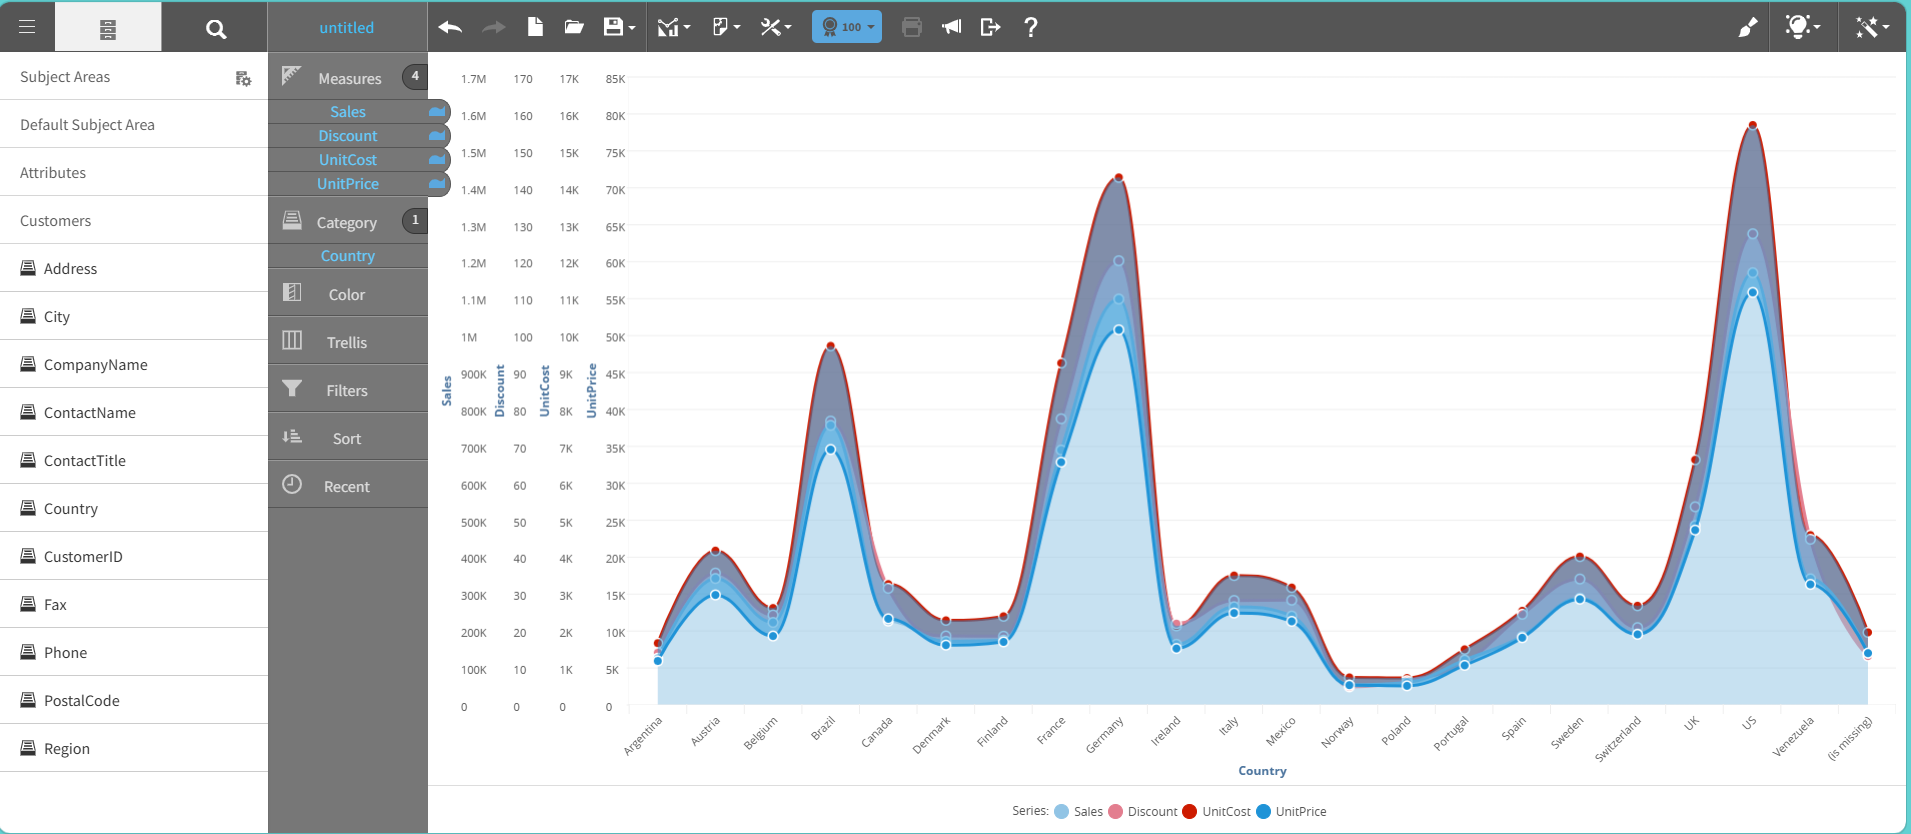
An areaspline chart combines a filled area with spline curves instead of straight line segments.
The chart highlights data volume and presents trend changes with continuous curved lines.
Use this chart in dashboards and presentations that require clear data display and consistent visual quality.
This graph shows an example of an areaspline chart:
For details on how to create an areaspline chart, see Creating a report by chart type.