Area chart
An area chart is a type of line chart that fills the space between the line and the axis with color or shading.
The filled area highlights the magnitude of values and the amount of change over time.
Area charts support the display of cumulative totals, part-to-whole relationships, and comparisons among multiple data series.
Different layouts include stacked and overlapping formats.
This graph shows an example of an area chart: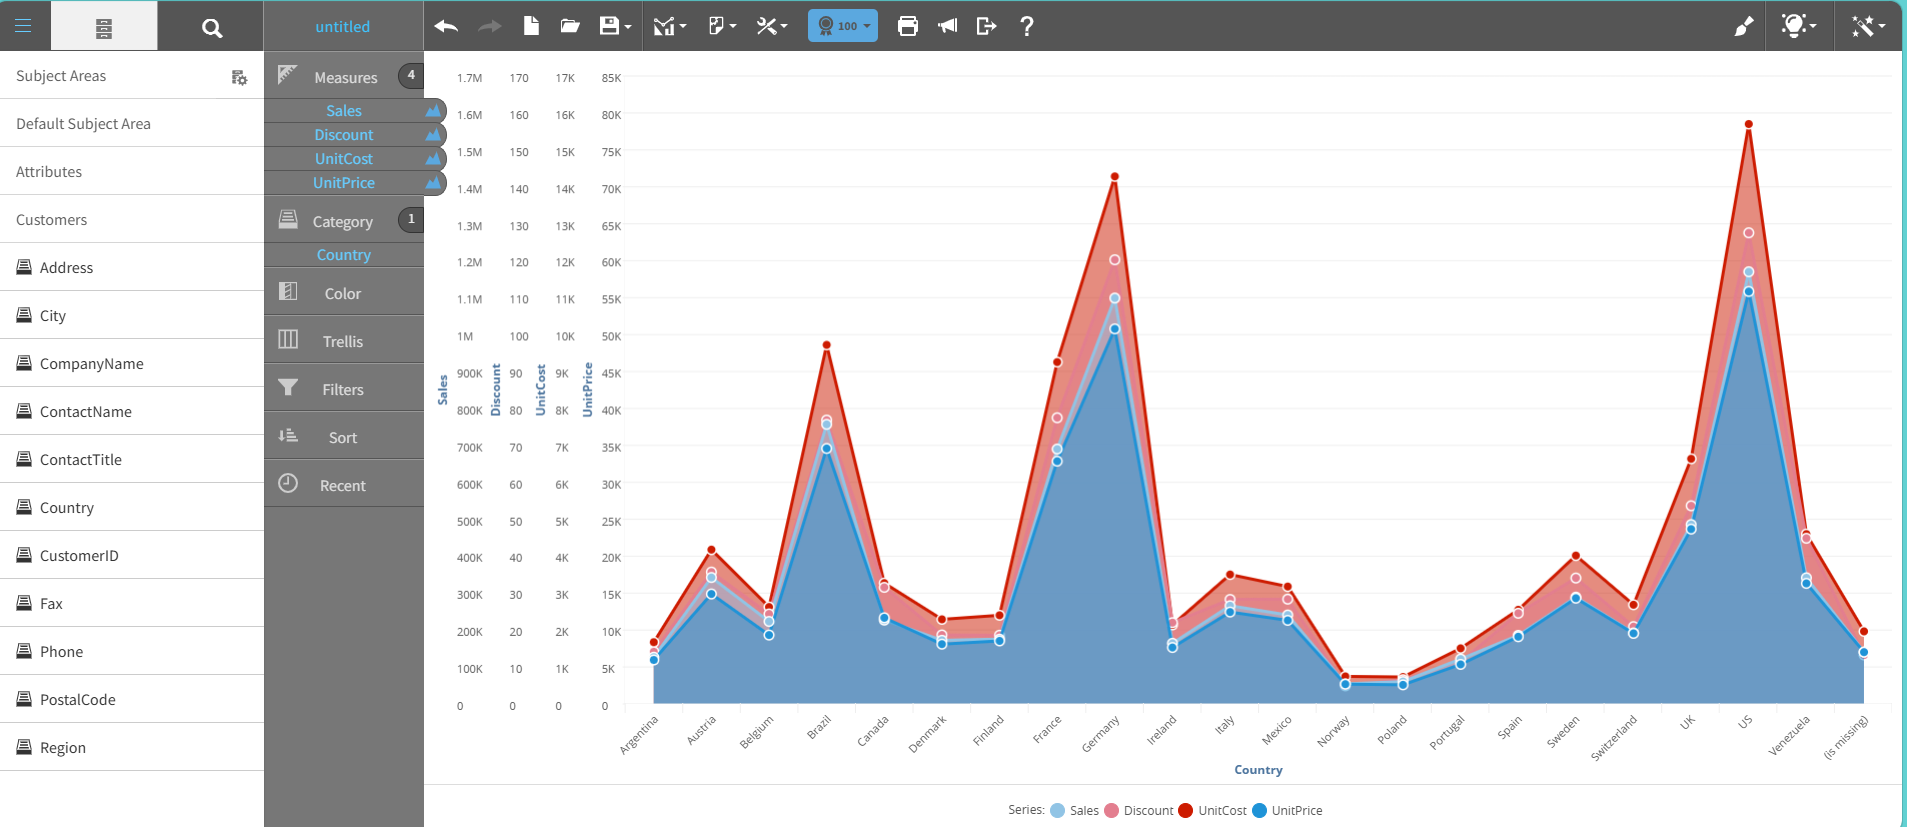
For details on how to create an area chart, see Creating a report by chart type.