Point and Scatter charts
Point and Scatter charts support consistent shape behavior and expanded visual options. The chart updates provide consistent presentation of categorical data and support clear visual analysis across chart types.
- Expanded shape options
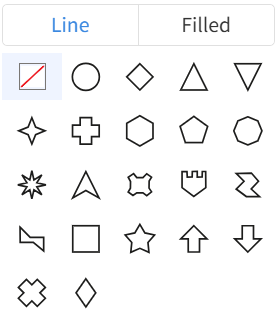
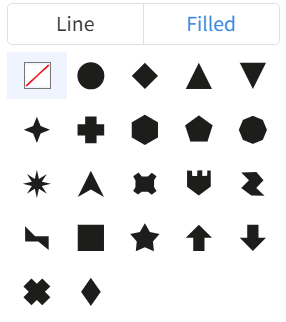
- You can select shapes from a predefined set of shapes, such as Line or Filled, and assign them to specific attribute values. This allows clearer visual differentiation of categories in Point and Scatter charts. This is the list of available shapes, both Line and Filled. Each shape is optimized for clarity at different chart sizes and screen resolutions.
- Granular shape and color customization
-
You can specify a unique shape and color for each attribute value. The Legend shows the assigned mappings. The chart saves all selections for consistent viewing across sessions.
Note: When Advanced Conditional Formatting is used to control shapes or colors, the does not display the corresponding mappings.
- Manual data point size control
-
Click the icon and select to specify data point size for Scatter and Point charts.
- When the Size field is empty, the slider sets one size for all data points.
- When a measure is in the Size field, the slider applies a proportional multiplier that scales the measure-based sizes.