Axis label editing in Visualizer Charts
You can rename the X and Y axis labels in Visualizer charts to improve clarity and readability.
You can edit labels directly on the canvas by using built-in controls to confirm, dismiss, or reset changes.
Renaming a label by double-clicking the axis label
- Move the pointer over an axis label, a tooltip states that the label is editable.
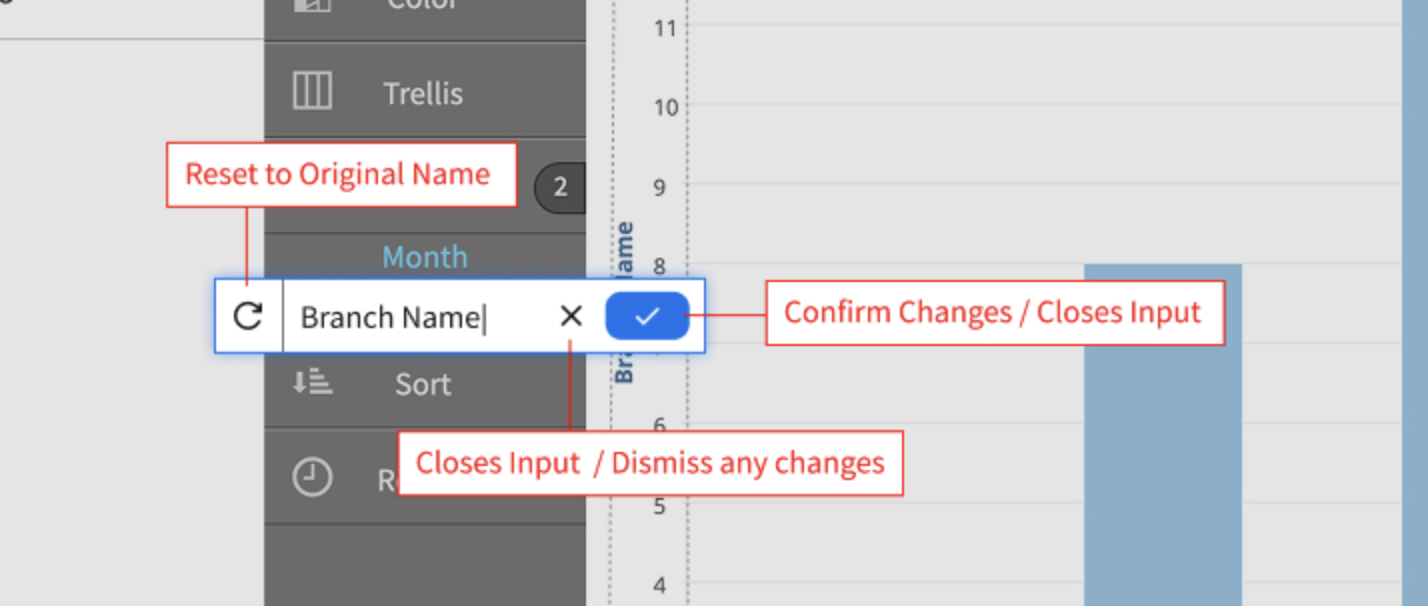
- Double-click the label. The label becomes an editable text field.
- These controls are available in edit mode:
- icon (✓) confirms the updated label and closes the text field.
- icon discards unsaved changes and closes the text field.
- icon (circular arrow) restores the original axis label.
- Click to confirm the updated axis label.
Renaming a label by using the Edit icon
Rename the axis labels by using the icon (pencil) next to each axis.
- Click the icon to open the menu.
- Select one of these options:
- icon (✓) confirms the updated label and closes the text field.
- icon discards unsaved changes and closes the text field.
- icon (circular arrow) restores the original axis label.