Width funnel chart
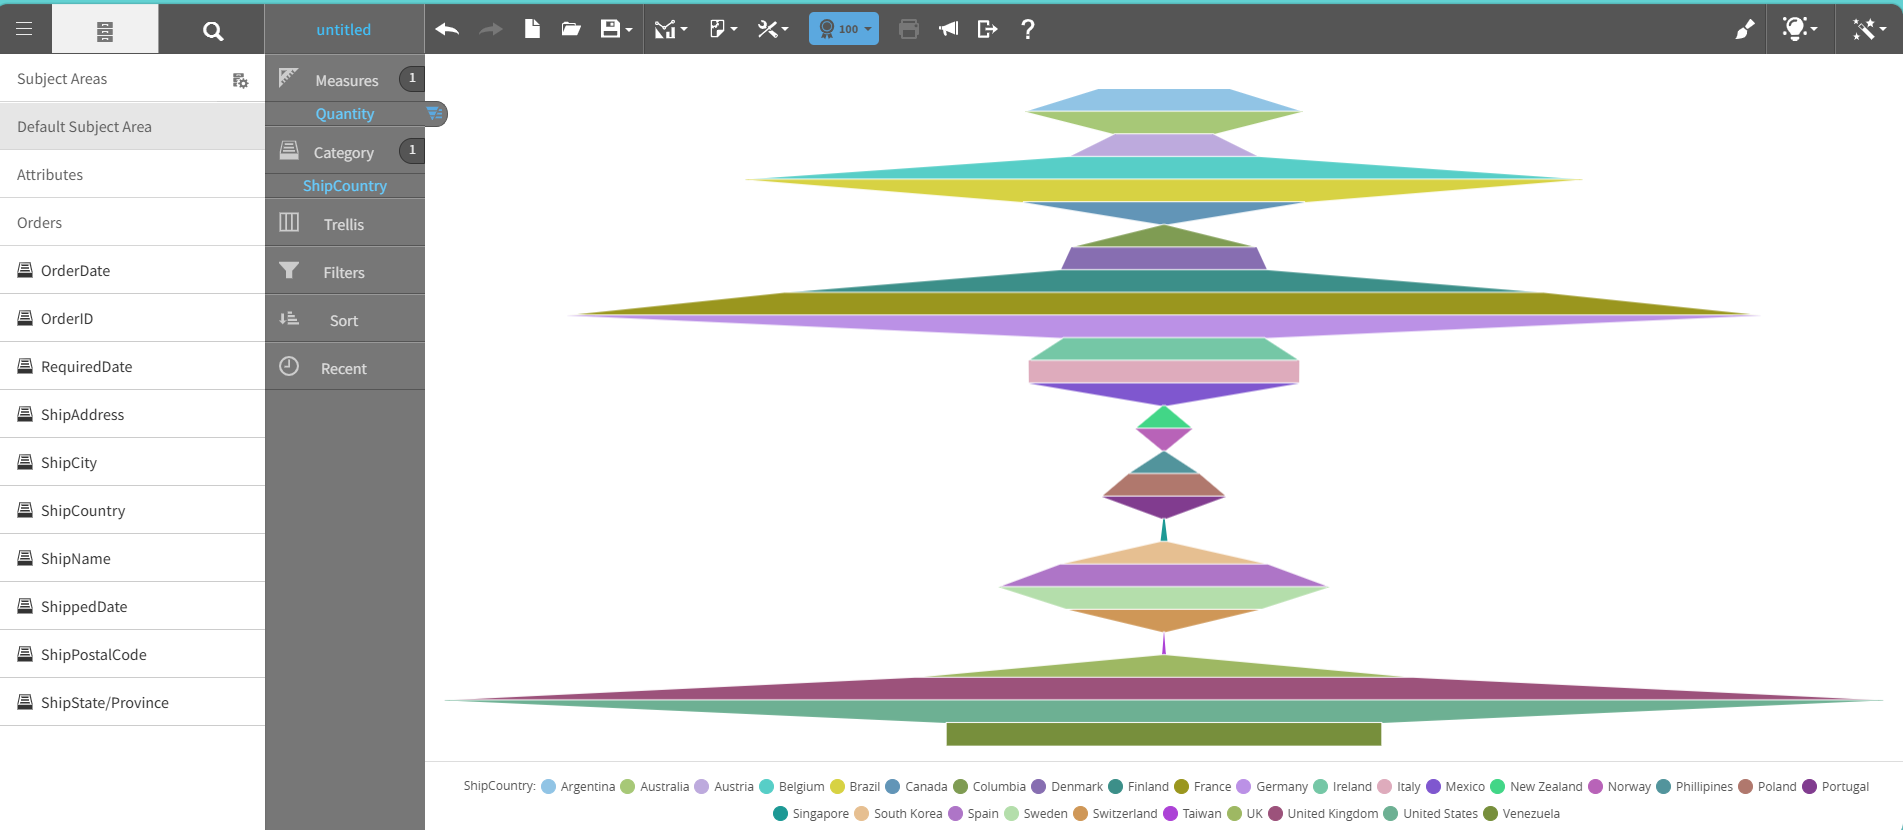
A width funnel chart represents values by adjusting the width of each segment rather than its height.
Each segment narrows as the value decreases, forming a funnel shape with a wide top and a narrow base.
Use a width funnel chart to:
- Show value reduction across ordered stages.
- Compare stage proportions.
- Highlight drop-off between stages.
This graph shows an example of a width funnel chart:
For details on how to create a width funnel chart, see Creating a report by chart type.