Creating a report by chart type
To create a report, select a chart type. Visualizer provides guidance on how to create the chart.
- In Visualizer, click Change Visualization icon. It shows you all available types of charts.
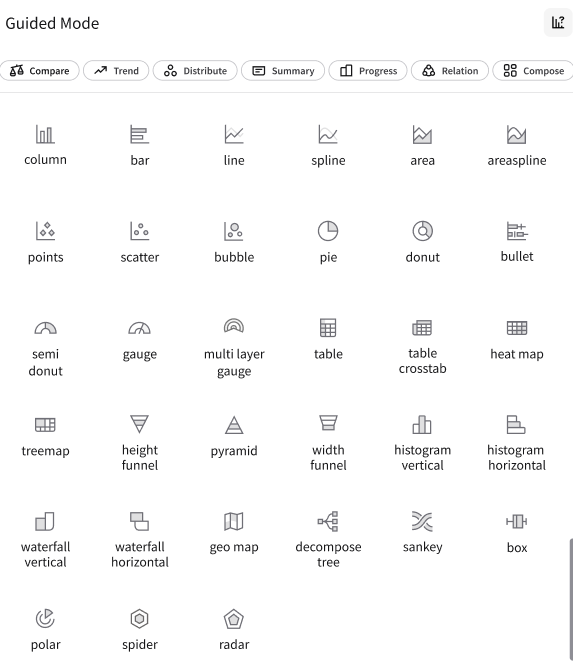
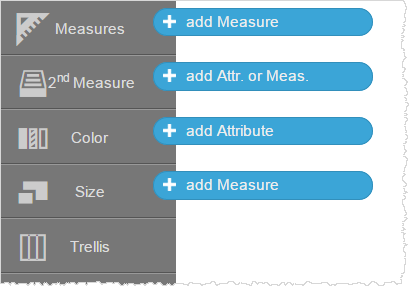
- Select the visualization type you want to use. Visualizer indicates what attributes and measures are required to create the report type. Many charts require only one measure and one attribute. Others, such as bubble chart, require more data to create a useful visualization. The Chart Builder shows only the sections that are applicable to the chart type. The sections that are displayed, such as Color and Size, differ depending on the chart type you select.