Getting Started with Visualizer
When working in Visualizer, you can choose to start with the data you want to use or with the type of visualization you want to create, whichever is more intuitive to you. Visualizer offers guidance at every step to enable you to create meaningful visualizations.
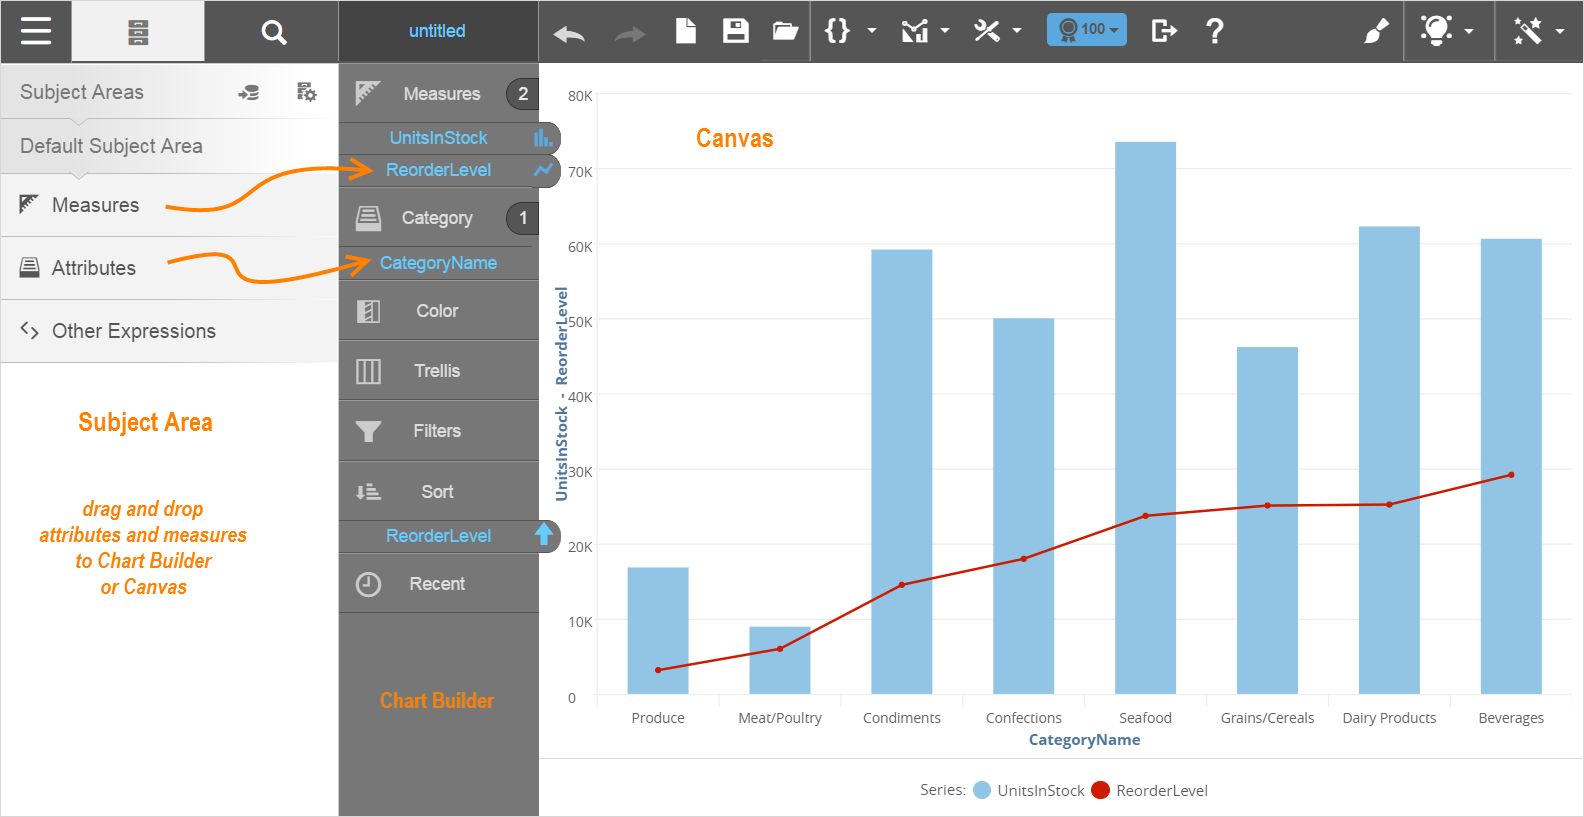
Visualizer has a contemporary user interface. Hover and click to experiment and learn the basics.
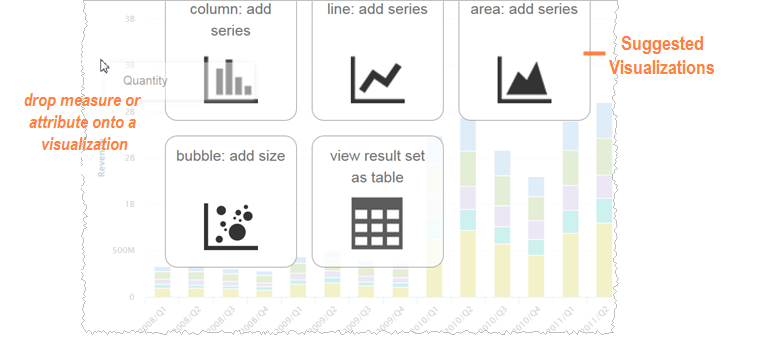
You can drag and drop measures or attributes into a visualization and view suggested visualizations to add.
The Visualizer Toolbar has features that allow you to create a new report, open existing files, perform metric analysis, and configure charts.
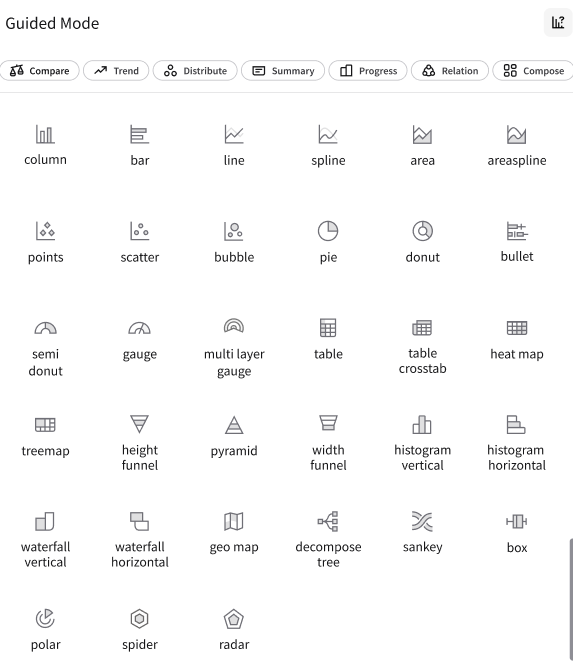
Visualizer has the option that enables you to set up the charts and reports you want.
The icon at the top right corner helps you to select the chart.
These options are available:
- : View differences between items.
- : View changes over time.
- : View data distribution, spread and range.
- : View key information at a high level.
- : View progress across a range.
- : View relationships and correlations between data points.
- : View how individual parts contribute to a whole.
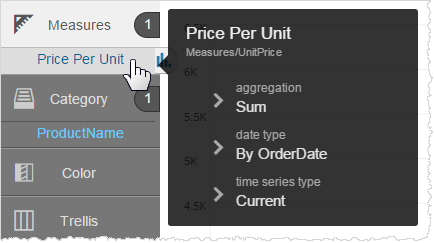
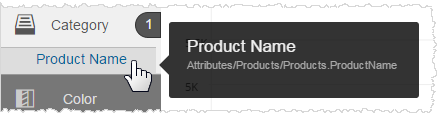
In Chart Builder when you hover over an attribute, measure, or report expression a pop up tooltip shows more details about them. For measures, you see the label (alias) name, original name, aggregation, date type, and time series type.
For attributes and expressions, you see the label and the full name.
Only users in groups that have been granted Visualizer access can see the Visualizer module. Space Administrators can assign Visualizer access to groups.
Visualizer report files (.viz and .viz.dashlet files) are managed by Space Administrators at Admin - Manage Access - Manage Report Catalog, just like reports created in Designer.
You can access Visualizer in one of those ways:
- Select a space then select the Visualizer module.
- Click the Visualizer link in the navigation bar or the Global Navigation Menu.
- From a dashboard, click the icon in the report (dashlet) header or in the Dashlet Actions menu to open a Visualizer report in Visualizer.