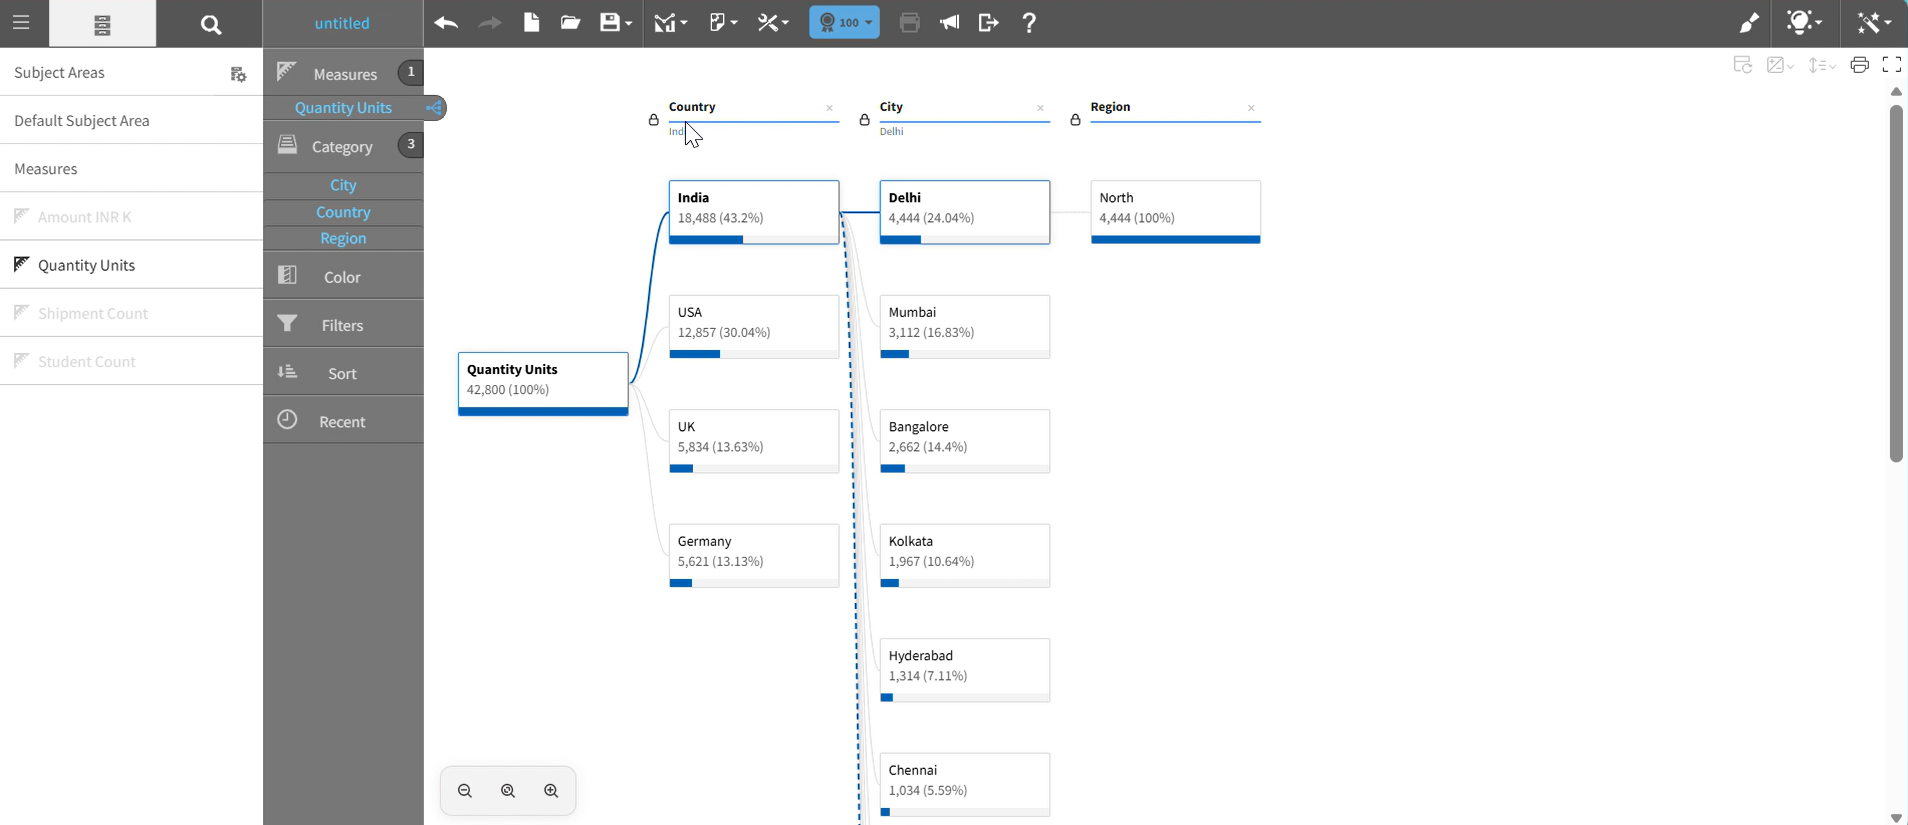
Decomposition tree chart
A decomposition tree is an interactive visualization for analyzing the factors that contribute to a key business measure.
A decomposition tree breaks down a metric, such as revenue, profit, inventory, or sales quantity, into dimensions, enabling a drill-down analysis to identify underlying trends, patterns, and root causes.
Key benefits of a decomposition tree chart include:
- Root-cause analysis: Identify factors that drive changes in sales, revenue, or inventory levels.
- Multi-dimensional analysis: Analyze ERP data across dimensions such as products, regions, orders, and customers.
This graph shows an example of a decomposition tree chart: