Multilayer gauge chart

A multilayer gauge chart shows multiple measures in a single gauge. Each measure appears as a separate layer to support comparison in one visual.
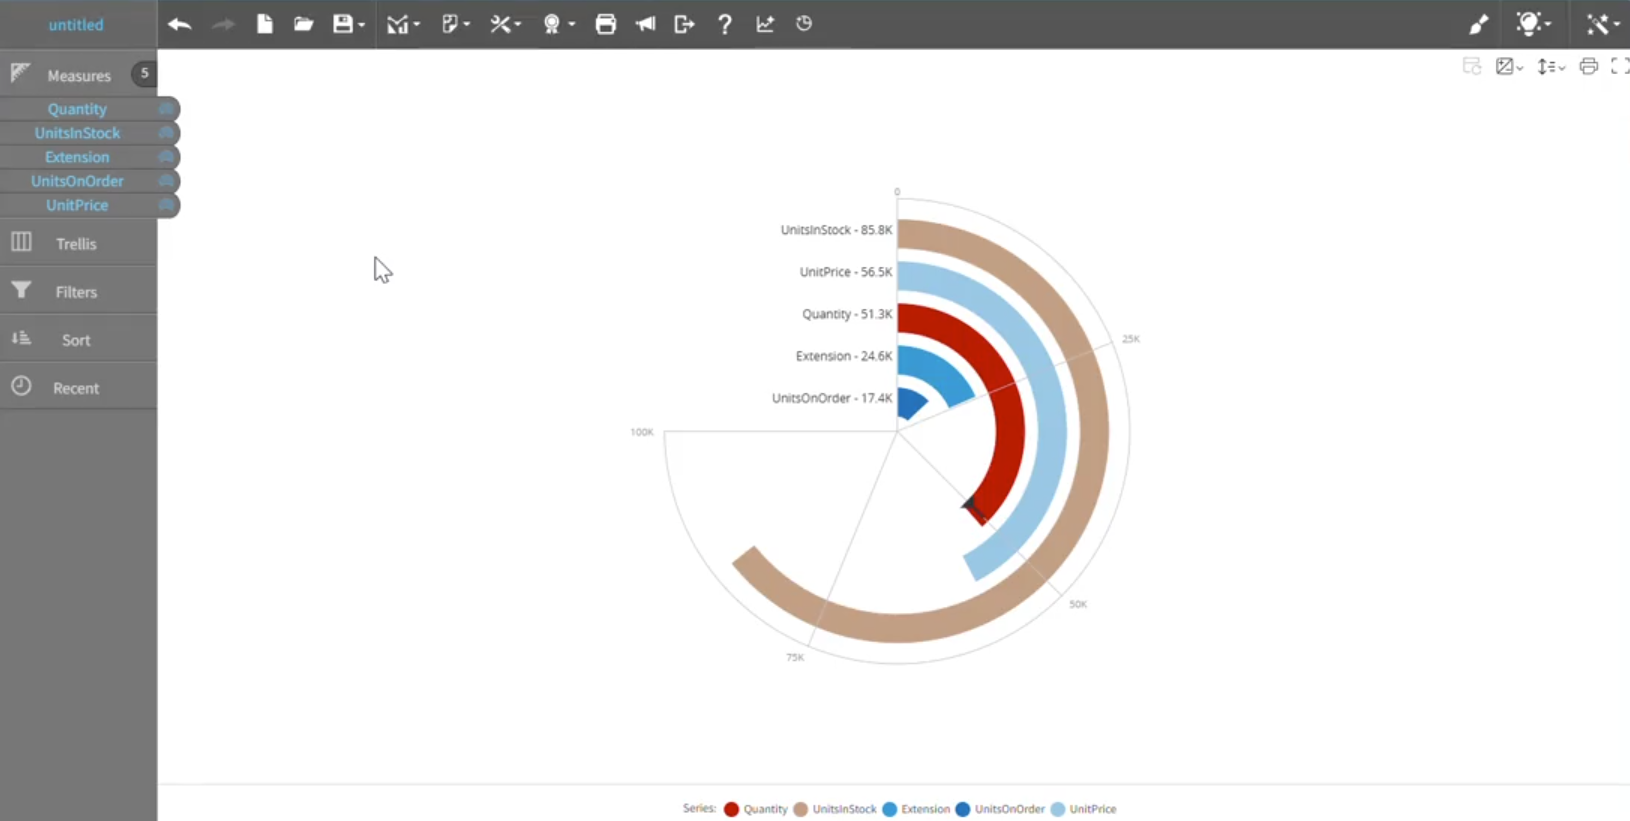
You can add multiple measures from the sidebar to create additional layers.

Each layer includes independent customization options:

  • Gauge axis: Minimum, Maximum, and Target
  • Segments
  • Colors
  • Target indicators

This graph shows an example of a multilayer gauge chart:

Multilayered gauge chart graph

Creating a multilayer gauge chart

  1. Select Guided Mode > multi layer gauge.
  2. Select Measures.
  3. Select Chart Settings > Chart Formatting to configure layers.
  4. Select one of the side menu buttons to customize the style of the chart:
    • General
    • Legends
    • Tooltips
    • Gauge settings
    • Display values
    • Conditionals
    Note: To switch between layers to modify their settings independently, click the arrow next to the layer in the Gauge settings to enable configuration for this selected layer.
  5. Click Done to apply the changes.