Waterfall chart
A waterfall chart shows the progression from a starting value to a final result through a sequence of positive and negative contributions.
A waterfall chart's segments are color-coded to indicate increases, decreases, and totals.
Use a waterfall chart to show how elements, such as revenue, costs, taxes, and adjustments, affect a net outcome. Typical results include profit, budget variance, and cash flow.
Visualizer supports two types of waterfall chart:
- Vertical waterfall
- Horizontal waterfall
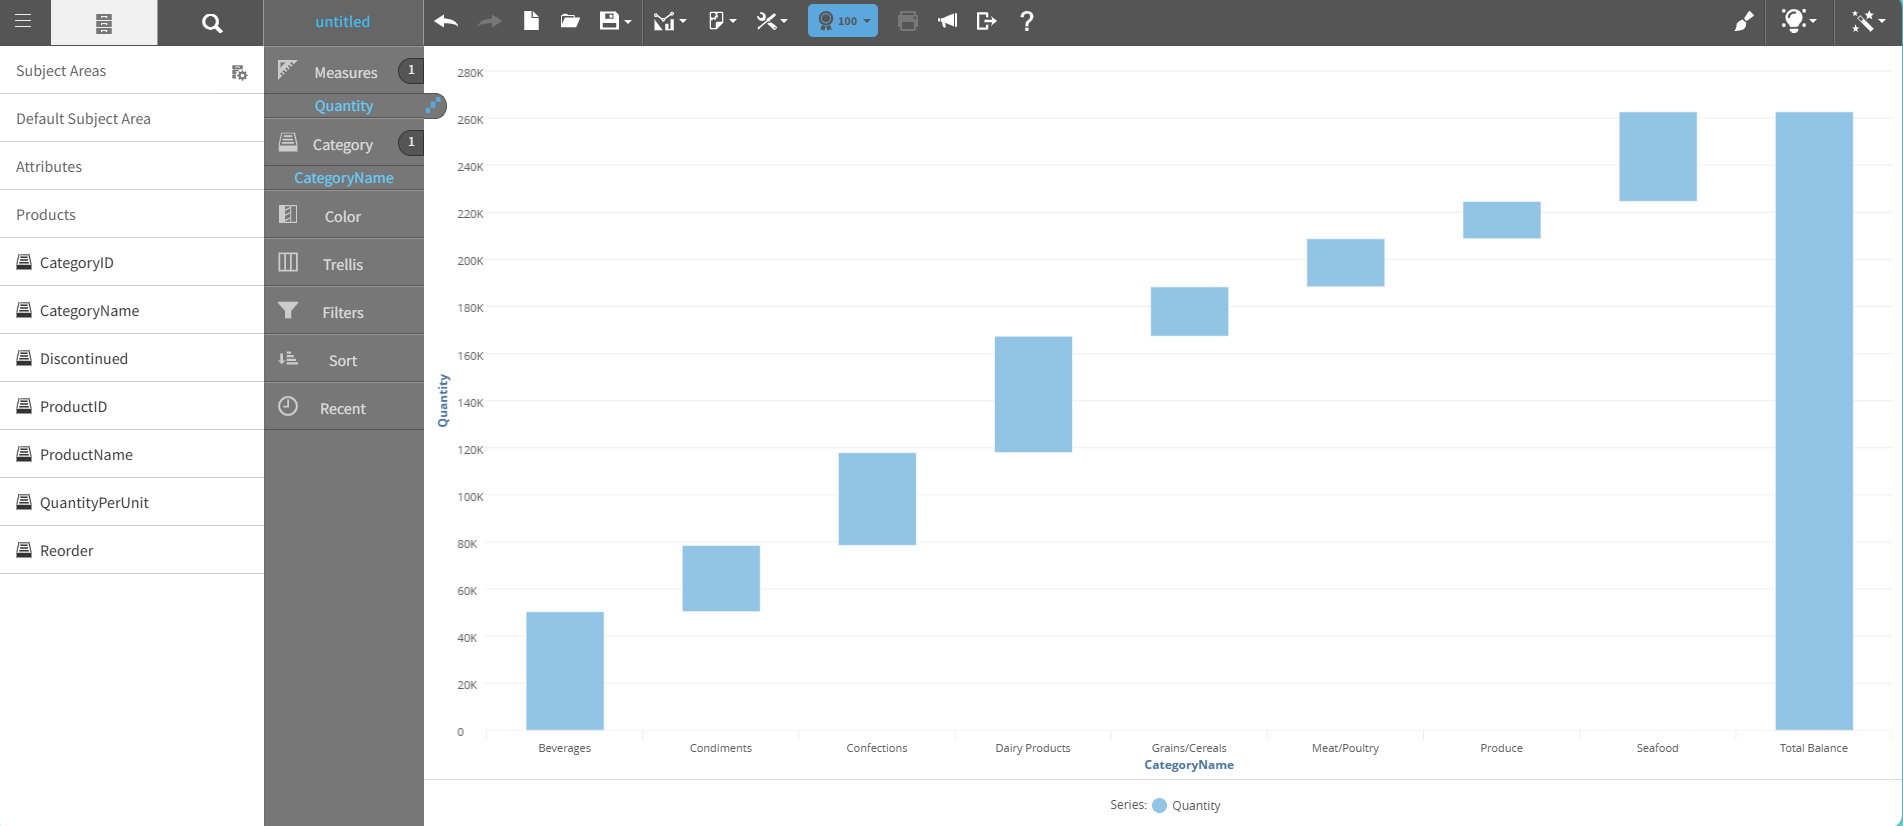
This graph shows an example of a vertical waterfall chart:
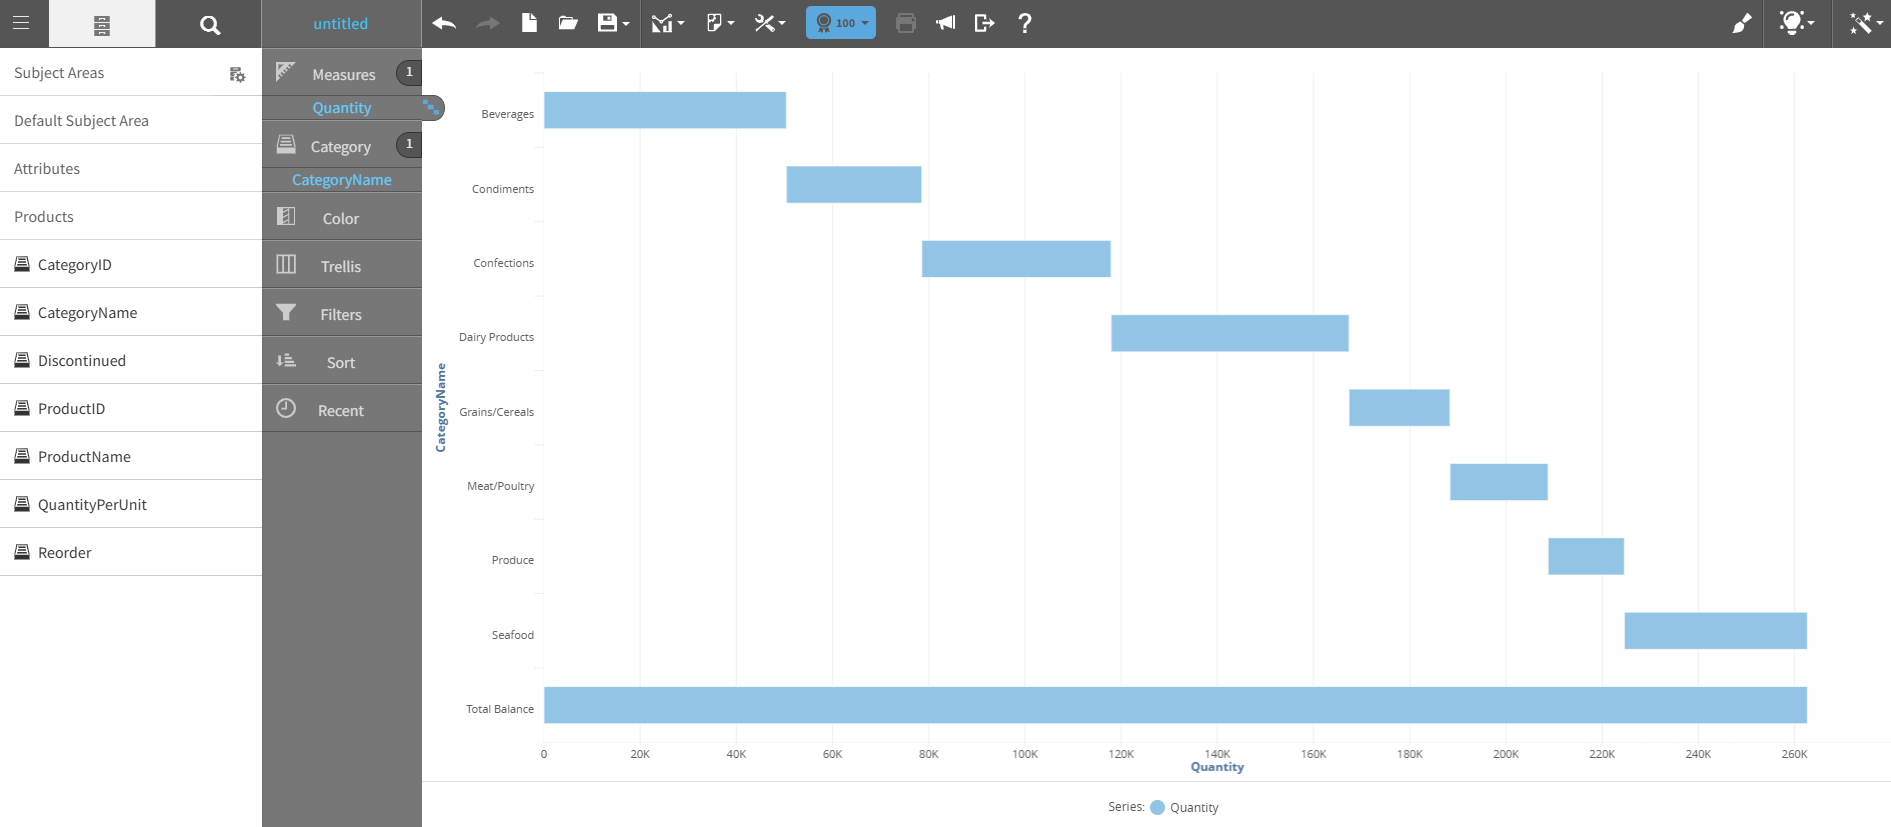
This graph shows an example of a horizontal waterfall chart:
For details on how to create a waterfall chart, see Creating a report by chart type.