Gauge chart
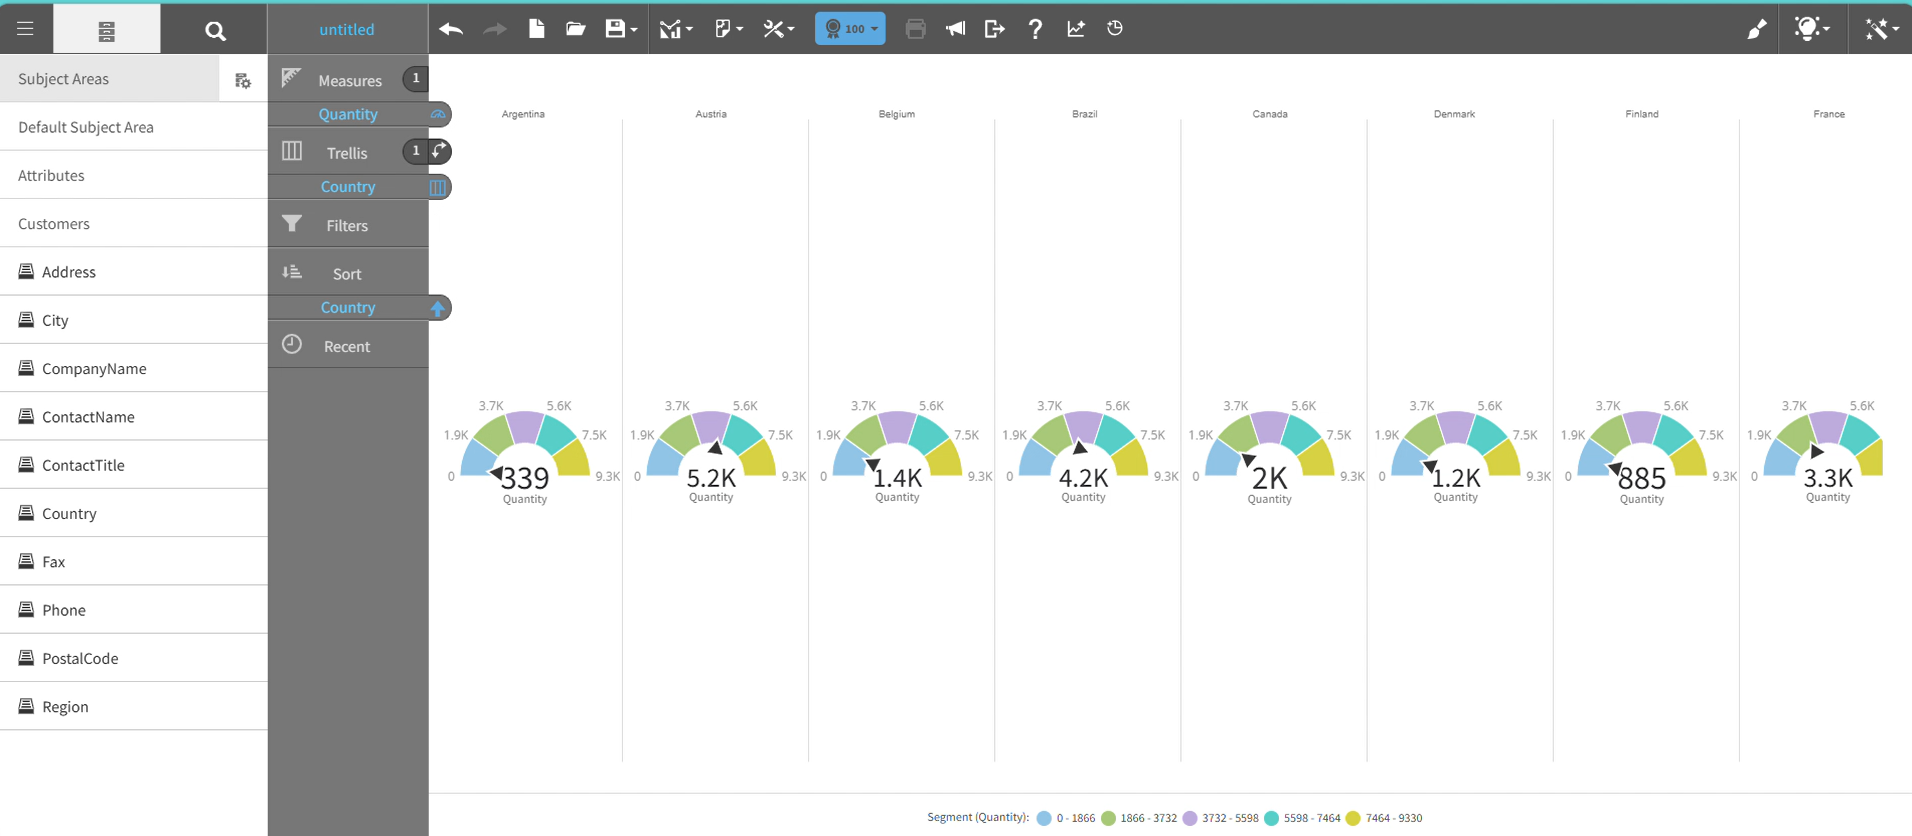
A gauge chart shows a single value within a defined range. Typically, gauge charts are used with colored threshold bands and a needle or arc to indicate the current value.
Use a gauge chart to monitor the KPI status and measure progress toward a target.
This graph shows an example of a gauge chart:
For details on how to create a gauge chart, see Creating a report by chart type.