Managing Impact Flow
- Select Global Navigation Menu > Data Tools > Impact Flow.
Note: You can also open Impact Flow from Filter Management and Expression Library to trace where a filter or saved expression is used.
- Click one or more elements in the side Subject Areas panel. Subject Areas include Default Subject Area and Custom Subject Area, each containing Measures, Attributes, Time Series Measures, Global Filters and Saved Expressions.
Note: You can use Search bar to find an element, or browse the Report Catalog to start from a report or dashboard.
- After clicking or dragging the elements to the canvas, you can see every report and dashboards that use them. Related items are color-coded, and when you rest on a node, it highlights the full path, and each node shows details, such as name, type, and location.
- Click the Open icon on any report or dashboard node to go directly to it in Visualizer, Designer, or Dashboard.
Note: You can check it both ways: start from a data element to find everywhere it is used (forward), or start from a report or dashboard to see what it depends on (backward).
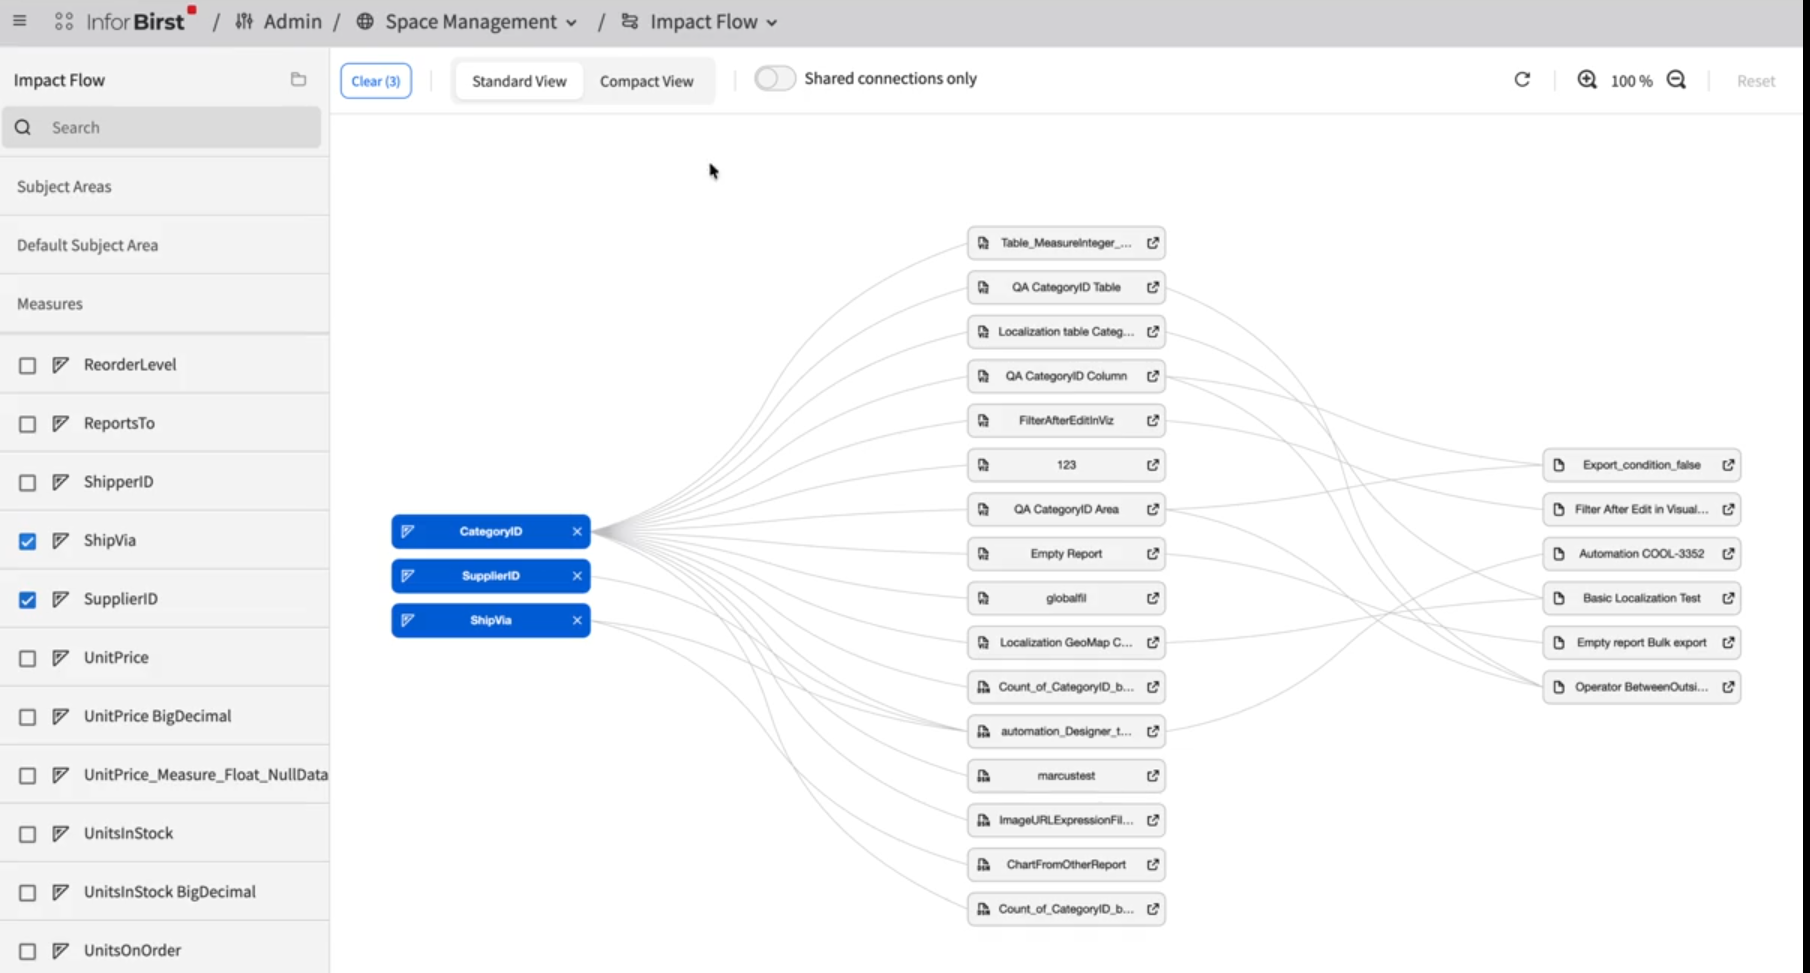
- In the canvas, you can use these options:
- Clear
- To clear the canvas.
- Standard View
- Compact View
- To switch the view for a table.
- Shared connections only
- By default, you see all connections for your selected items. Enable the switch to see only the items your selections have in common.
- Refresh
- Zoom
- Reset