Creating a Crosstab Report in Visualizer
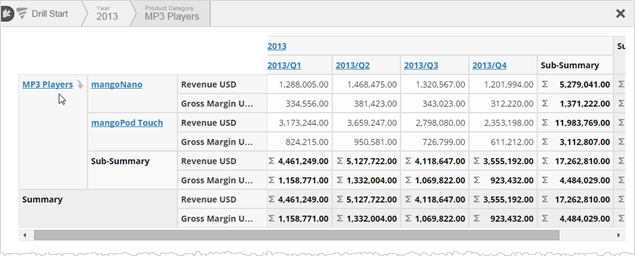
A crosstab report is a table made of multiple measures, attributes, and summaries. A crosstab can be thought of as a concatenation of related simpler tables, and is sometimes called a pivot table. When you provide a Visualizer crosstab report on a dashboard, you can sort on rows, columns, or summaries to see details.
The basics of creating and formatting a crosstab report are the same as that of a table. See Creating a Table in Visualizer.
Note: In Chart Settings, you can lock crosstab column and row headers by selecting and This is the default behavior.
Click the icon on the top menu bar to export a crosstab report as a PDF or export the data to Excel.
Use the crosstab report on a dashboard. See Adding a Visualizer Report to a Dashboard. You can also use Visualizer crosstab reports to:
- Drill
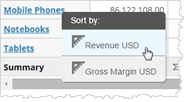
- Sort
- Switch headers
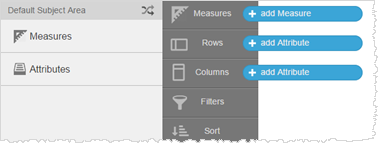
 select crosstab. The Chart Builder prompts you to select the minimum two attributes and one measure required for the report.


