Adding sizes to visualizations
Some visualizations are more useful when you add a dimension represented as Size.
- Add a measure to a bar chart and change it to another chart type that uses Size. Visualizer suggests charts that work best with Size.
- Click Save.
For example, drag the Quantity measure to the Canvas and choose bubble chart from the options.
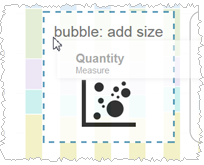
Visualizer creates a bubble chart using the Quantity measure as the size of the bubbles.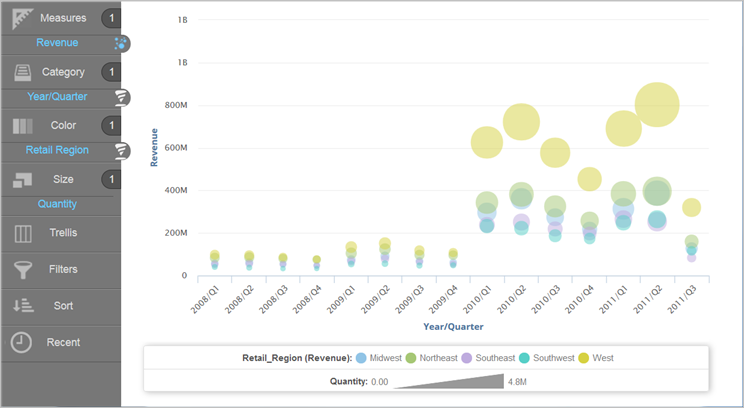
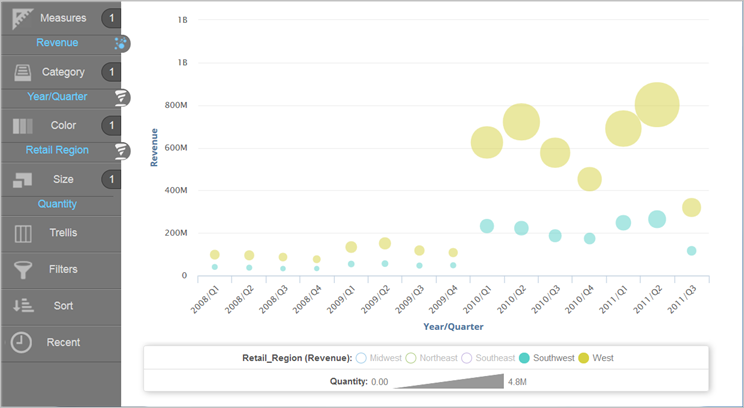
In a bubble chart, you can click on items in the legend to hide or show bubbles in the chart.
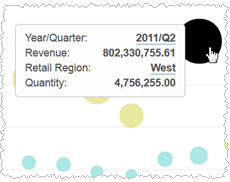
You can rest your cursor on a data point to see its details.