Formatting table summaries in Visualizer reports
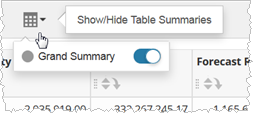
- By default, Visualizer adds a Grand Summary at the bottom of measure columns. To enable this option, click .
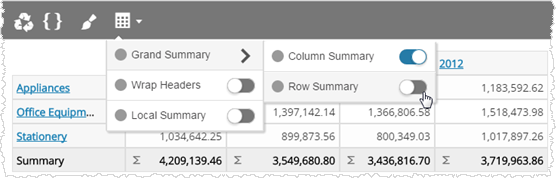
- For crosstab reports, select or to control the visibility of row and grand summaries.
- To change the default auto-summary for a measure column, click in the column header and select a option.
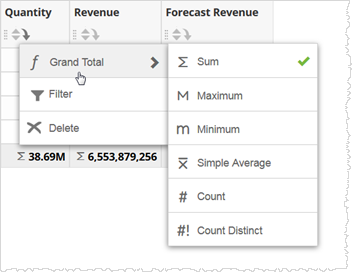 You can set measure grand totals to one of these options:
- None
- Displays the summaries and sub-summaries as blank.
- Sum
- Displays the sum of the values in that column.
- Maximum
- Displays the maximum value in the column.
- Minimum
- Displays the minimum value in the column.
- Simple Average
- Displays the average in the column.
- Count
- Displays the number of items in the column.
- Count Distinct
- Displays the number of unique items in the column.
Note: To change the label of an auto-summary row, click the icon .
.