Applying conditional formatting
-
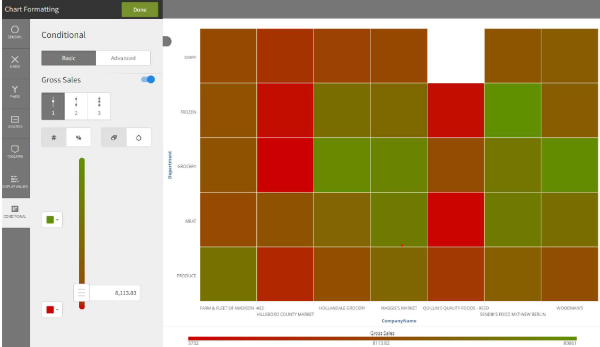
Select color overrides. For example, select colors and set conditions for a range
of Gross Sales: You can set the conditions for the color gradients as either a number
or percentage.
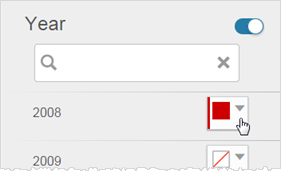
 As another example, these are conditions when using a time dimension: