Display report on a KPI and dashboard, transformation tutorial
Dashboards are how you display and distribute one or more of the charts or tables you create in Visualizer. For example, the manager wants to share the dashboard with the home office using email.
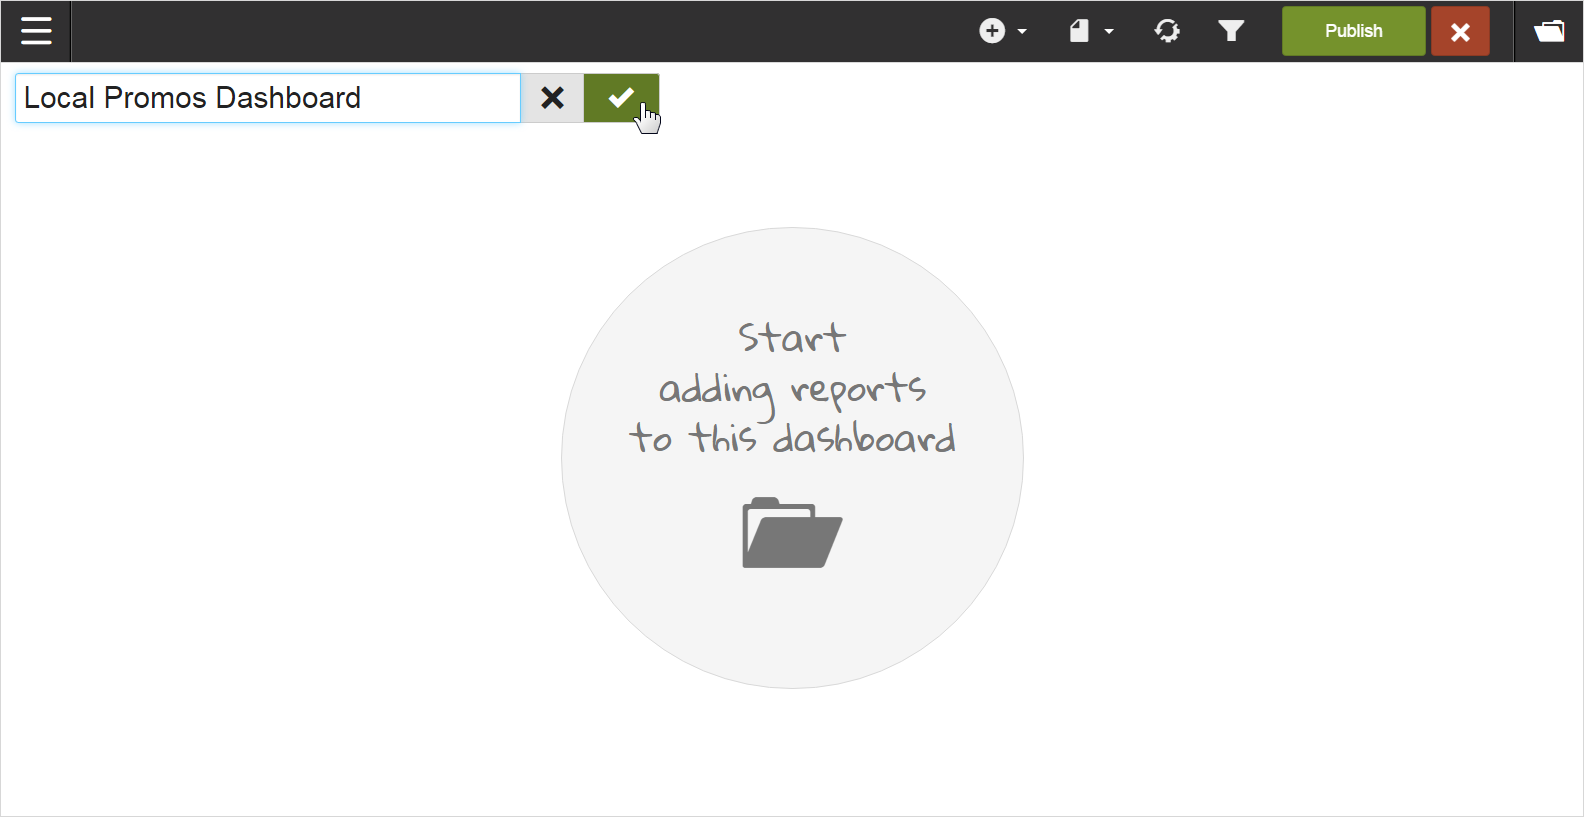
Navigate to . An empty dashboard is displayed.
Specify a new Name for the dashboard, then click .
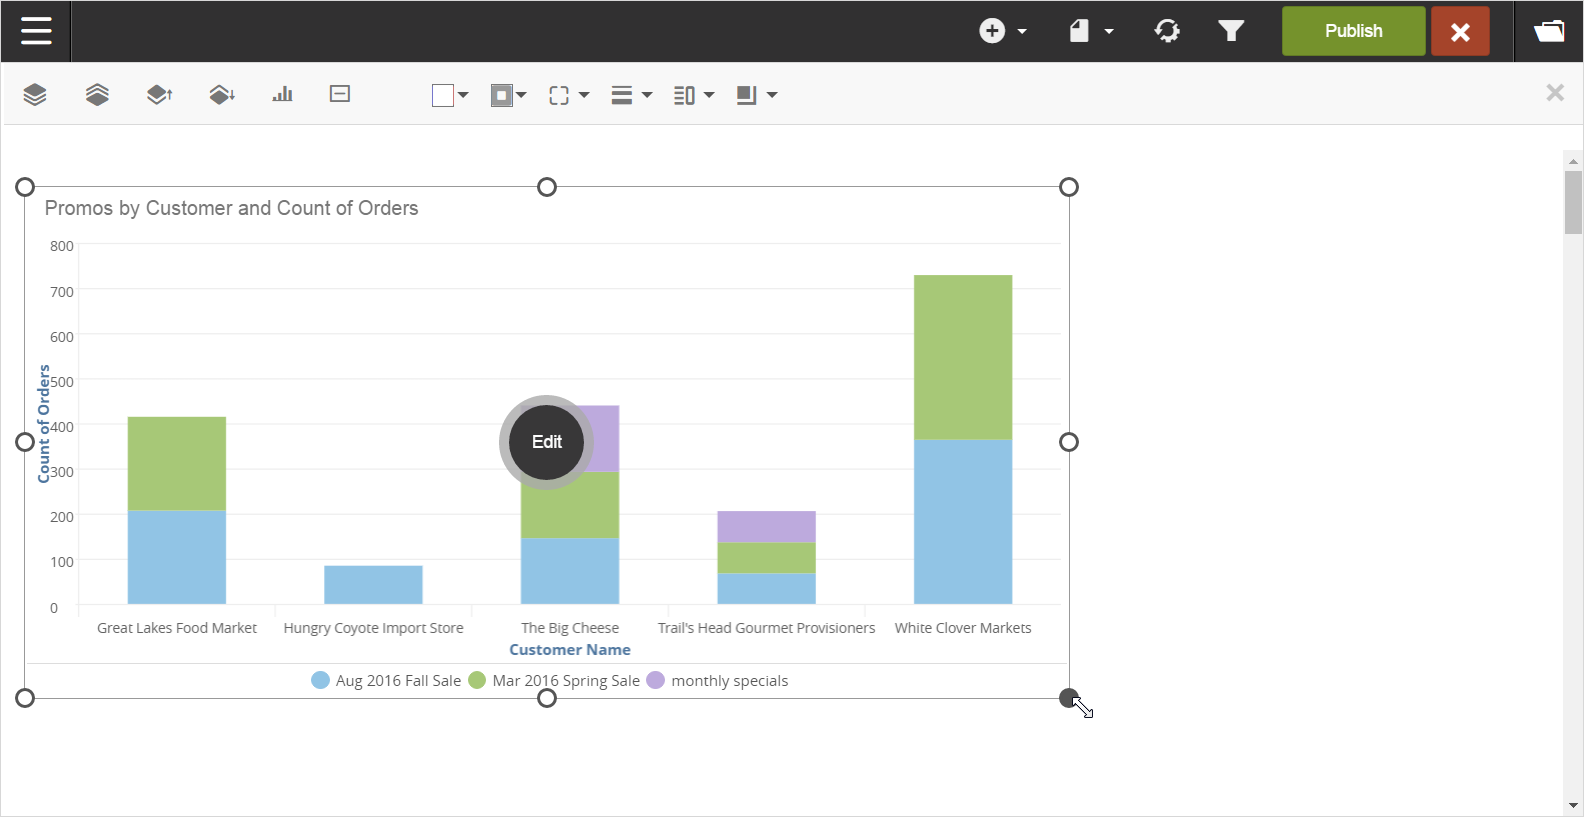
Click in the dashboard to add a report. Select the report to add from your local computer, and then click .
You can move and resize the report on the dashboard.
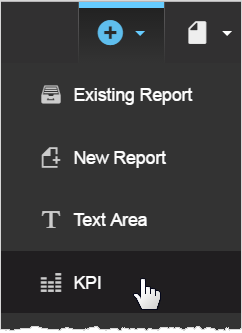
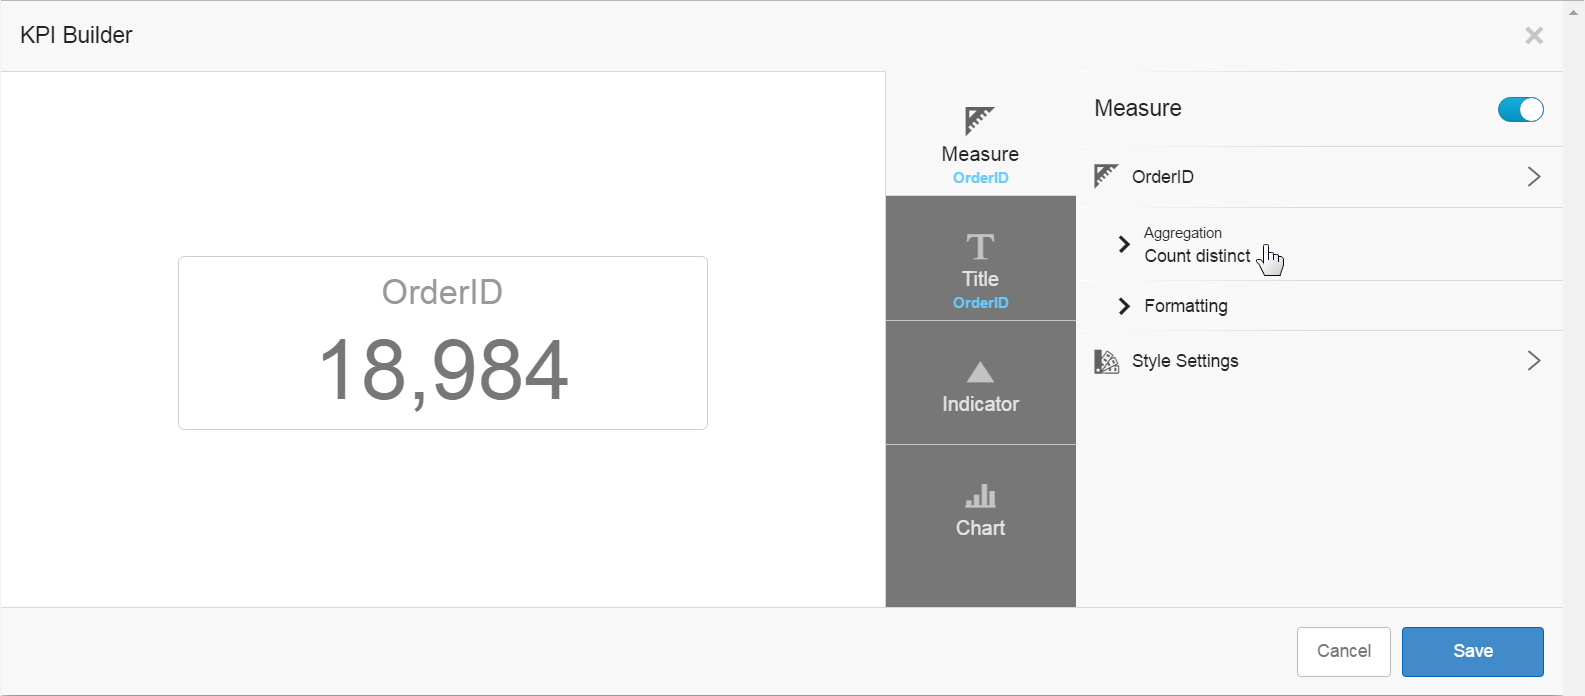
Another way to show information on a dashboard is to use a Key Performance Indicator (KPI). For example, the manager wants a quick count of the total number of orders. Select :
KPIs are for measures, so they are listed in the KPI Builder. Navigate to the OrderID and change its aggregation to Count Distinct.
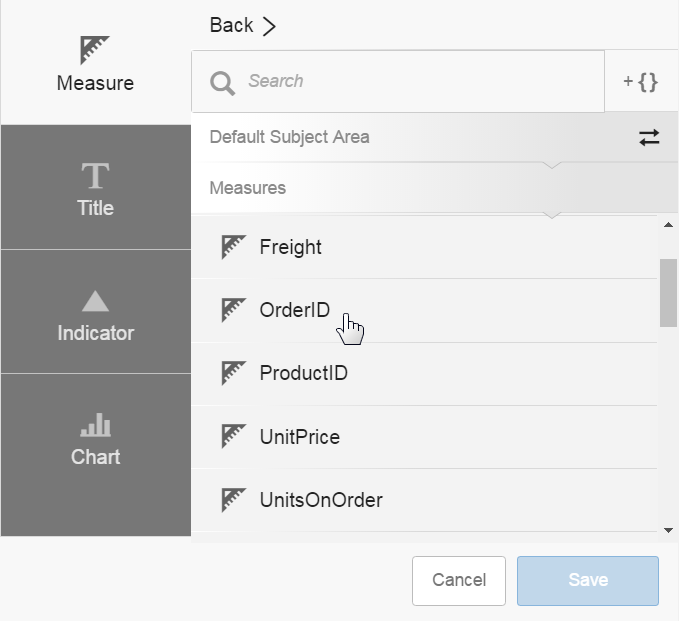
A preview of the KPI is displayed on the left.
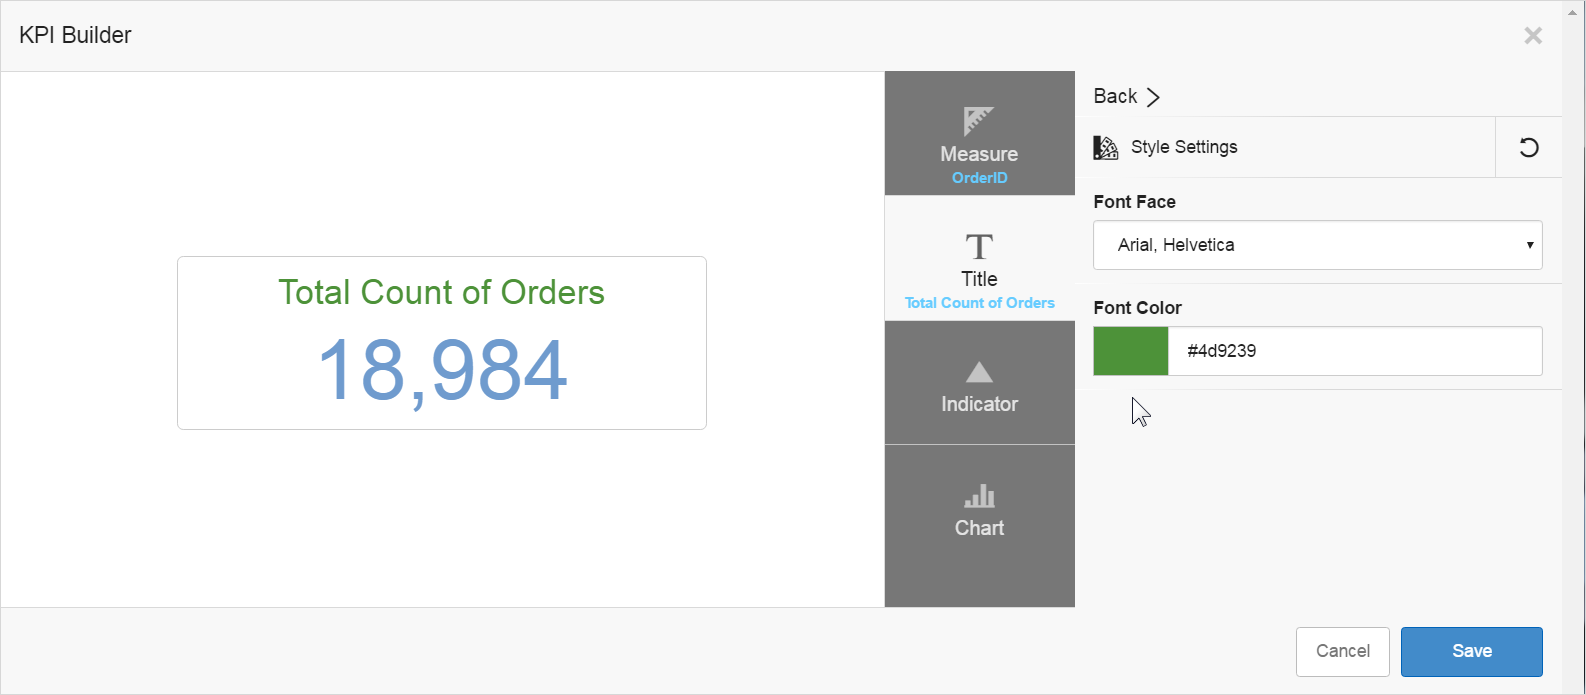
You can use Style Settings to change style settings for the measure number.
Additionally, you can change the title name and its style.
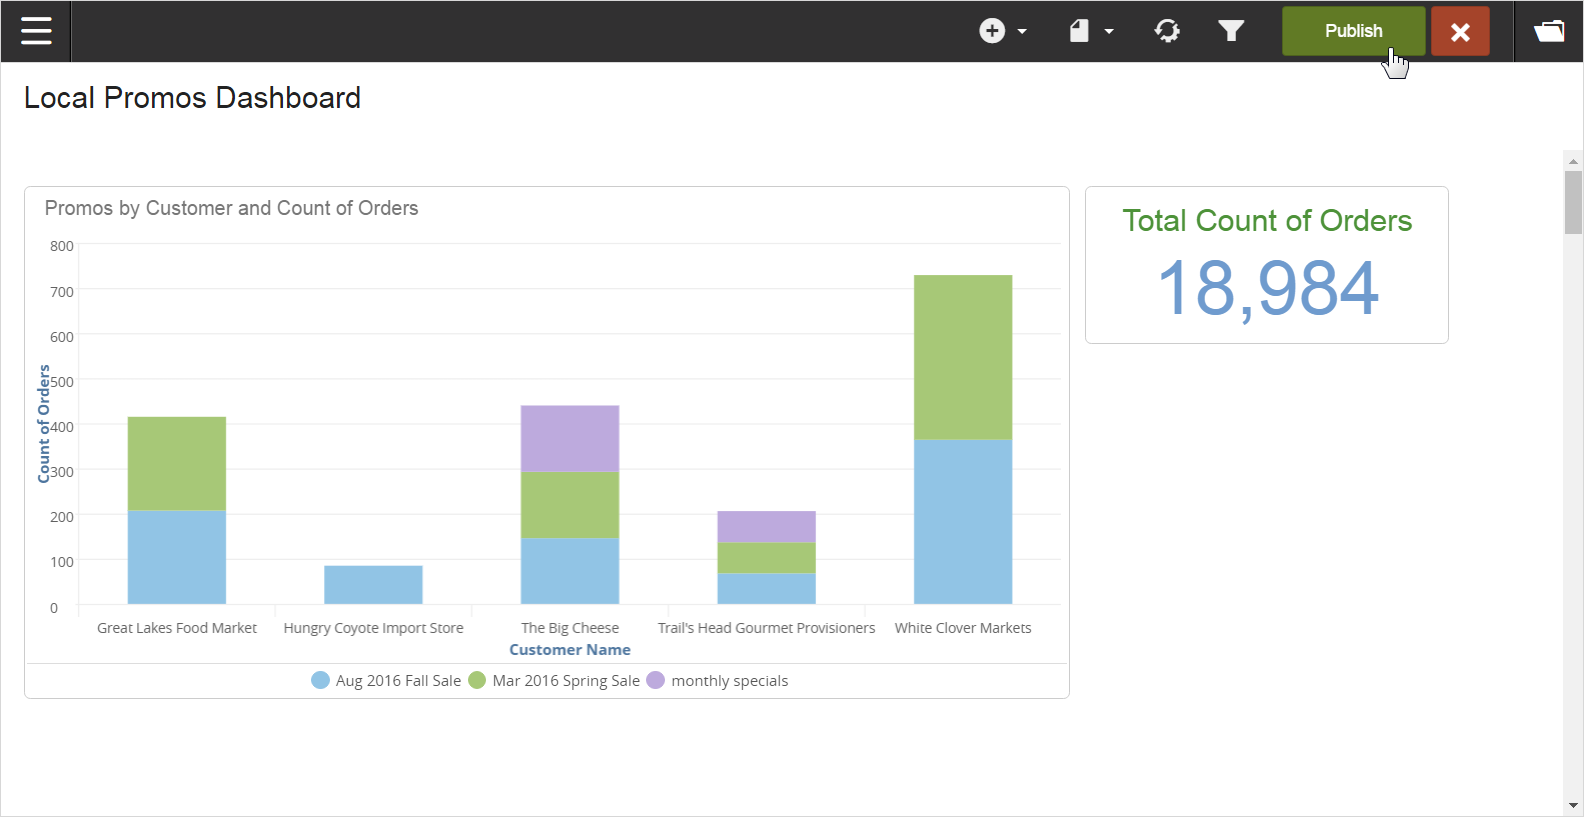
Click and place the KPI on the dashboard.
Click to save the dashboard.
There are many more features and things you can do with dashboards.