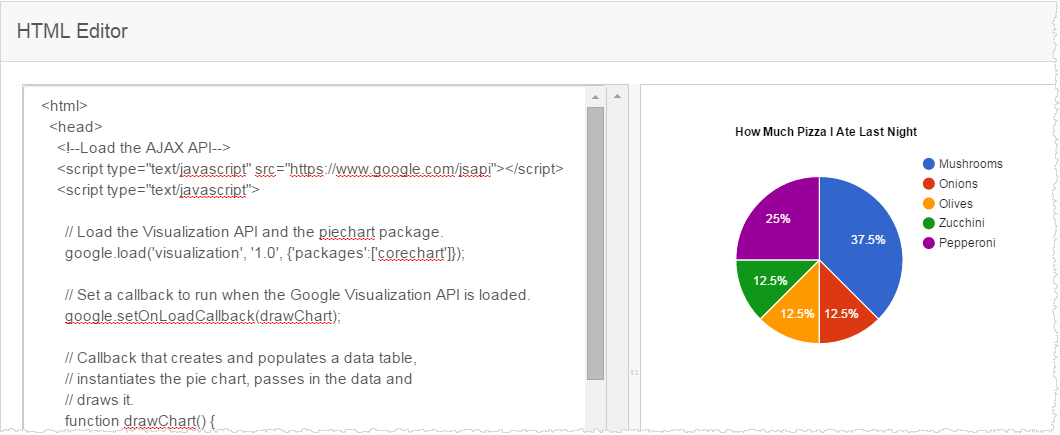
Example: embedded Google visualization
The example makes a pie chart using the Google charting library. Copy/paste the code into the HTML window and Birst displays a preview of the chart.
See the example code: Embedded Charting JavaScript Example.
The example makes a pie chart using the Google charting library. Copy/paste the code into the HTML window and Birst displays a preview of the chart.
See the example code: Embedded Charting JavaScript Example.