Sorting Data in Visualizer
Sort data in a report using Sort in the Chart Builder. Measures can sort ascending or descending. Attributes sort alphabetically or reverse-alphabetically.
To change the way data is sorted
|
1.
|
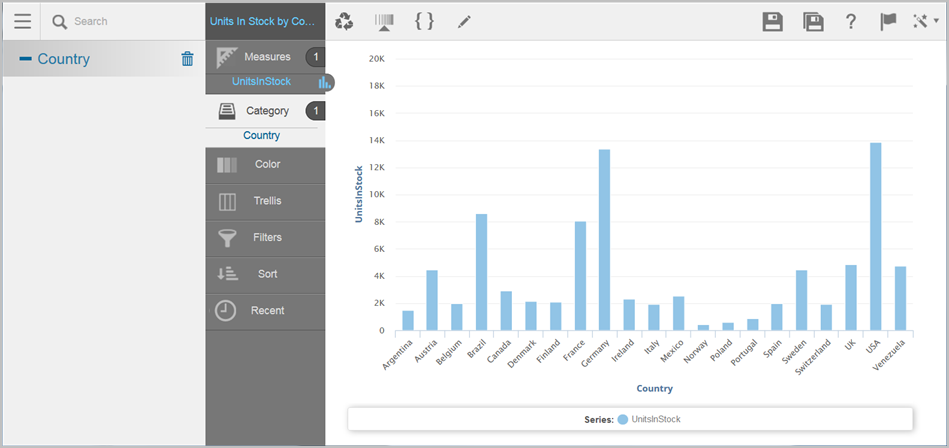
Add the attributes
and measures you need to create your chart. For example, Units in Stock
by Country.
 |
|
2.
|
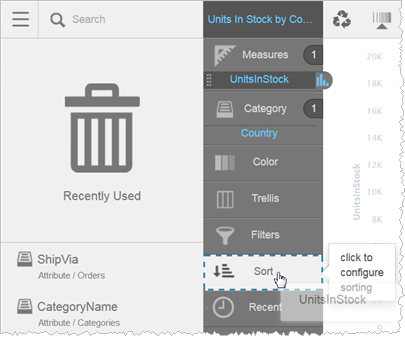
To sort, in
the Chart Builder drag a column and drop it on Sort. For example, to sort
by UnitsInStock, drag UnitsInStock from Measures to Sort.
Important: Sorts do not take effect by dragging a column
from the Subject Area to Sort. You must use a column that is already in the Chart Builder. To hide a column see Adding Tooltips and Hiding Columns.
 |
|
3.
|
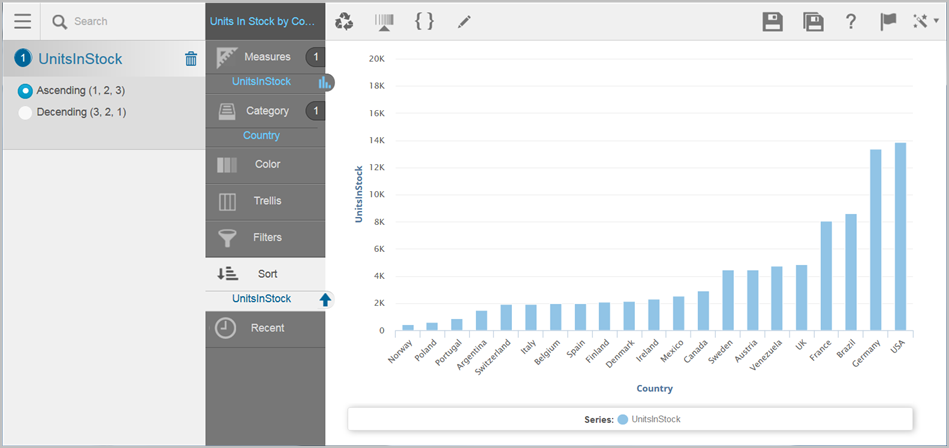
Visualizer
sorts the measure or category (attribute) according to its default sort criteria.
For example, UnitsInStock sorts from lowest to highest.
 |
|
4.
|
You can change
the type of sort to apply. Visualizer provides sort options in the Subject
Area. |
|
5.
|
You can add
additional columns to Sort.
Tip: When sorting on two measures where one is an expression, the sort on the expression takes precedence. This is because expressions are sorted at mid-tier whereas basic columns are sorted at the database level.
|
|
6.
|
Click Save
 . . |
Learn More
Visualizer
Report Basics
Working
with Chart Reports
Working
with Tabular Reports