Creating Column Selectors
Column selectors let business users change attributes, measures, or both, of a chart or table in Dashboard filter. Column selectors allow your reports to become very versatile. For example a report with column selectors can:
- Apply different attributes that are not related in a hierarchy.
- Provide an alternative way to drill down or up through a hierarchical set of attributes.
- Apply different measures to the same attribute.
Column selectors can reduce the number of reports needed on a dashboard by allowing a single report to do the work of multiple reports.
A column selector applies to a set of attributes and/or a set of measures. You can mix attributes and measures in a column selector. Set up the column selectors in your Visualizer report for use in Dashboard filter.
To create a column selector report:
- Add an attribute and a measure to the report.
- Click Advanced Tools > Column Selectors.
- In the Column Selectors panel, drag and drop an attribute or
measure onto the corresponding bucket.
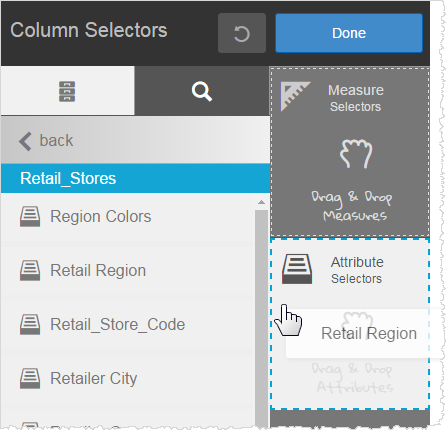
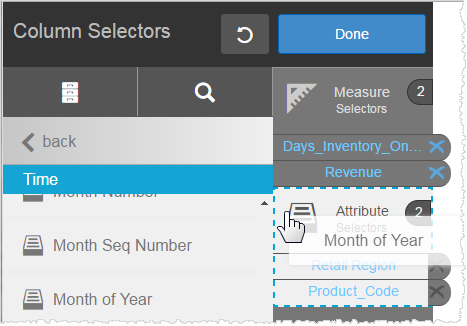
The panel updates with the new selector. - Optionally, click Back to go to the list and add more attributes
or measures.Note: Remember that the original chart already has at least one attribute and one measure. It is not required to add them as column selectors. Click the X to delete an attribute or measure from a bucket.
- Click Done.
- Click Save.
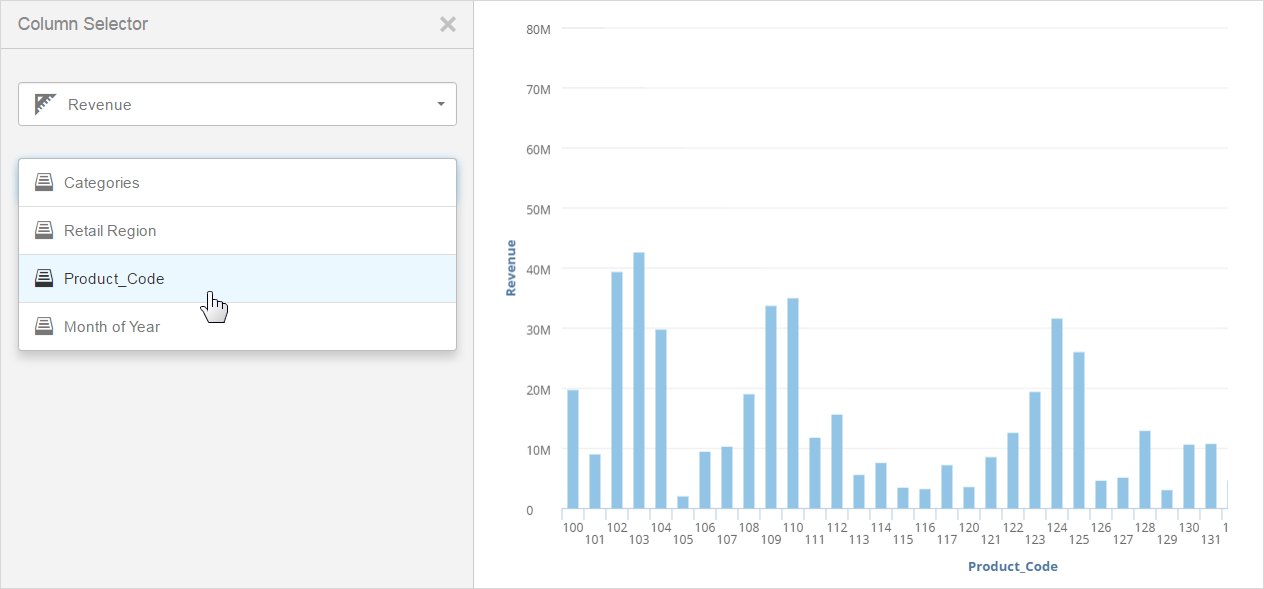
- Click Advanced Tools > Column Selectors Preview to see the new selectors.
- Test out the column selectors. Iterate to make changes if needed. Click
X to go back to Visualizer.
Next Steps:
Add the report to a Dashboard filter dashlet and save the dashboard. See Creating new dashboards in the Infor Birst Dashboards User Guide.
When business users access the dashboard, they can click Dashlet Actions and then to toggle the attributes or measures to update the report.