Overlaying measures on a geomap
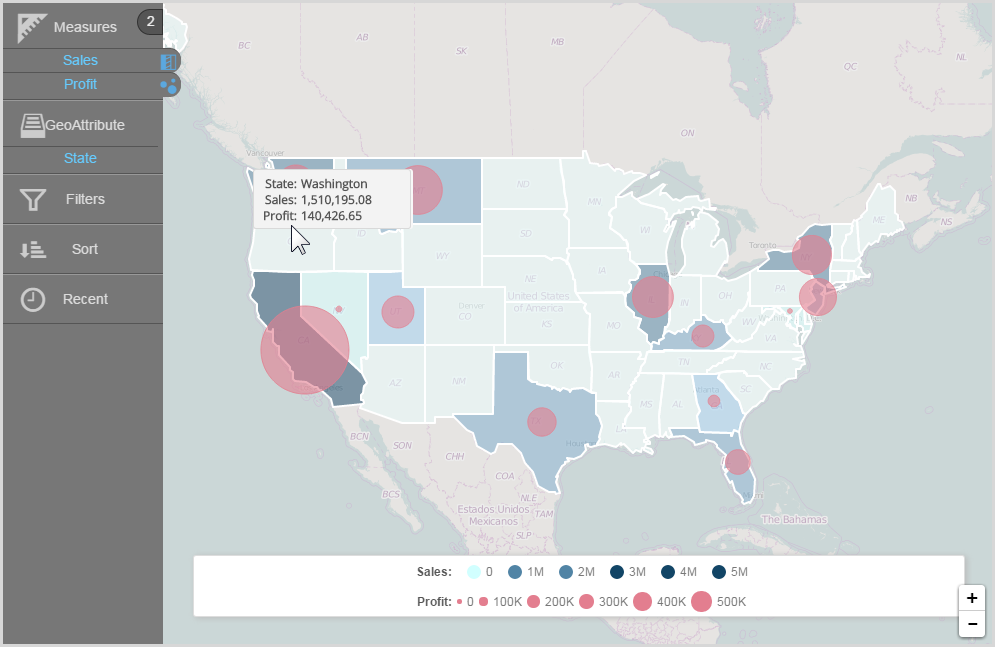
You can show one measure as a heatmap, another measure as a bubble map, and another as markers.
- Add a second measure to an existing map; for example, Profit.
- Select the alternate chart type. Visualizer shows the two measures in two different chart layer styles.