Formatting tooltips

Formatting at the tooltip level overrides formatting at the data level.

You can change the font style, units, suffix, decimal precision, and currency symbol used in tooltips.

Note: By default all tooltips show a black background that cannot be changed.
  1. Click Chart Formatting (paintbrush icon) and click the Tooltips tab.The Chart Formatting Tooltips panel opens.
    • If there is only one measure, all of its formatting options show.
    • If there are multiple measures, text formatting for all of them together, for consistency, is at the top. Later you can select individual measures to format the other items.
  2. Check which measures and attributes show in the tooltip.
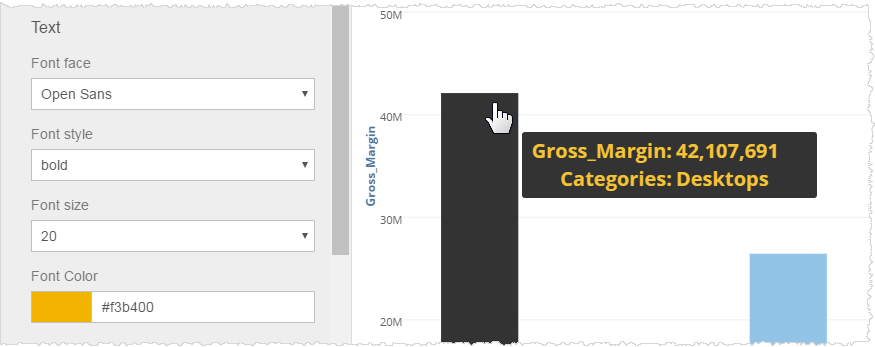
  3. Change the font color, face, background highlight, size, or style of the tooltip text. The tooltip formatting updates. For example:
  4. Format the data:
    • Change the Units. The default is take from the underlying data. The numbering style changes based on the Unit.
    • If appropriate, change the Suffix to percentage.
    • Set the decimal display.
    • Choose a currency prefix.
  5. Click Done.