Showing display values on charts
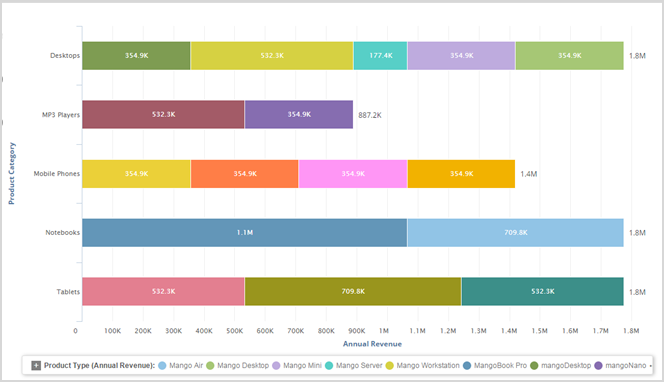
You can change the display settings so that values are displayed on bar or column charts.
- Click Chart Settings.The Chart Settings list shows the Display Values toggle.
-
Switch on the Display Values option. The
value of the measure displays at the end of the bars in a column or bar chart. If you
have a color attribute, you can display the segment values as shown here:
