Ignore Unneeded Columns, dashboard tutorial
In the previous step you learned how to hide a column during the merge transformation. What about the second SupplierID column from the first merge? Modeler has a transformation called Ignore that does the same thing.
Click , then Scroll right to the second SupplierID column, SupplierID_CorpData_xls Suppliers and click its check box. Then click the transform.

For extra practice, find the Fax column and it.
There are different transforms to choose from in Modeler. You can merge columns together, such as for address blocks. You can fill in empty cells using "null handling", replace text, and filter the rows.
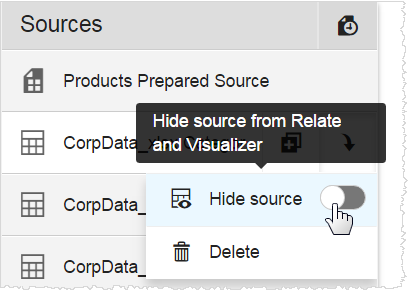
The next step is to decide whether to show the original sources when you use Visualizer or Dashboards. For this tutorial, since you merged all the raw sources together, you don't need to make the raw sources available for reporting, you can just use the prepared source.
Rest your cursor on each raw source on the left and select from the list menu.

Click .
Modeler shows a status bar while it retrieves all the data from the source, applies the two merges, and hides the two "extra" columns. Then it saves all of that in Birst and you can use it to make charts, tables, and dashboards.
When it is done it shows the publishing information in a tooltip.
If you are wondering, "What exactly is Publish?", that is a great question. Publish is when Birst takes the raw data and walks it through the pipeline, applying all the transformations, and making it ready for use in reports and dashboards.
You can create reports in Visualizer first, or go to Dashboards and create or add to an existing dashboard. For this tutorial the next step is to create a chart in Visualizer.