Composing dashboards
Dashboards group related reports that support the business intelligence needs of business users. Dashboards can have multiple pages of reports for easier browsing. A dashboard page usually contains one or more dashboard filters, or prompts, to give users the ability to see different aspects of the information.
After you create reports in Designer or Visualizer, you can build dashboards to display the reports.
The newest version of Dashboards is based on the latest user interface technology and interaction design. Use Dashboards to provide an intuitive and responsive user experience, and to seamlessly integrate with Visualizer. When you need to deploy dashboards on mobile devices, use the new Dashboards.
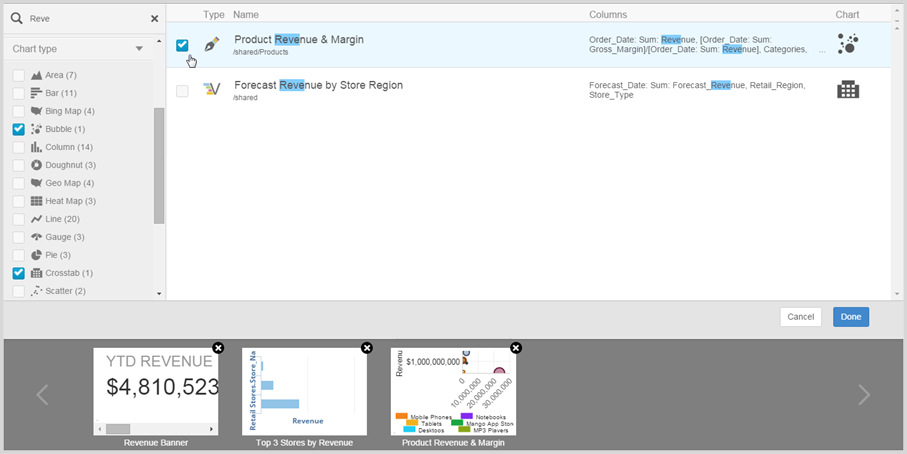
You can add reports to a dashboard by selecting them from a list of reports.

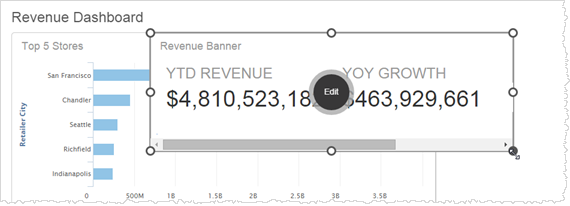
Then you can organize the layout, add text blocks, filters, and other widgets.

Dashboards can also include external web pages, and embedded HTML and JavaScript. For example you can call out to a public web page and display it on a dashboard.

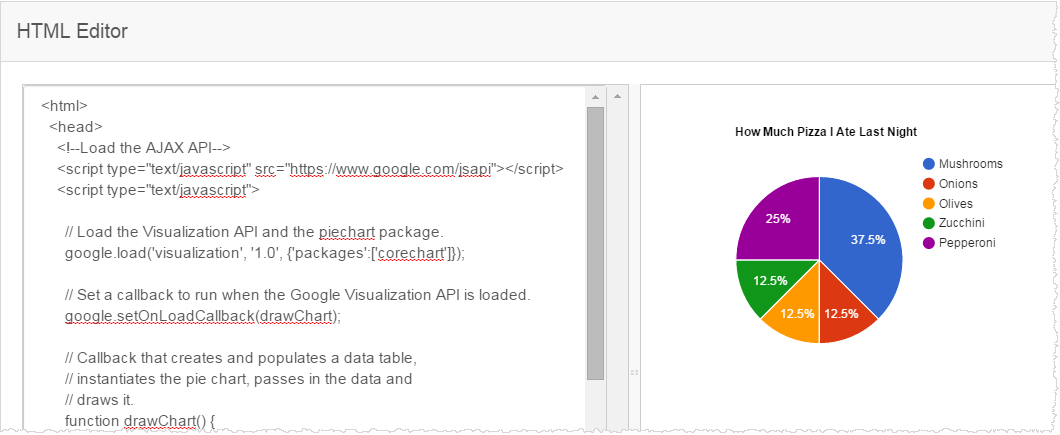
The HTML Editor lets you add HTML and JavaScript directly to the dashboard.
