Special cases for Visualizer table exports and Excel
When exporting Visualizer reports to Excel, discrepancies can occur between summary totals in Visualizer versus Excel Summary Total.
For columnar tables, these use cases produced discrepancies for calculated Custom Summary Totals that are reported when Excel reports are exported because of their inability to apply formulas against the data in the database but rather against the values that are listed solely in the exported Visualizer report. In these uses cases, Visualizer now employs a bare table export.
This list shows the use cases that affect Custom Summaries for columnar tables:
- Total Distinct Count
- Weighted Average
- Custom Summaries based on Expressions
Crosstab table exports were affected by these uses cases.
- Total Distinct Count
- Weighted Average
- Custom Summaries based on Expressions
- Count
- Count Distinct
In these use cases, the tabular data is exported from Visualizer to avoid the miscalculation of the custom summaries.
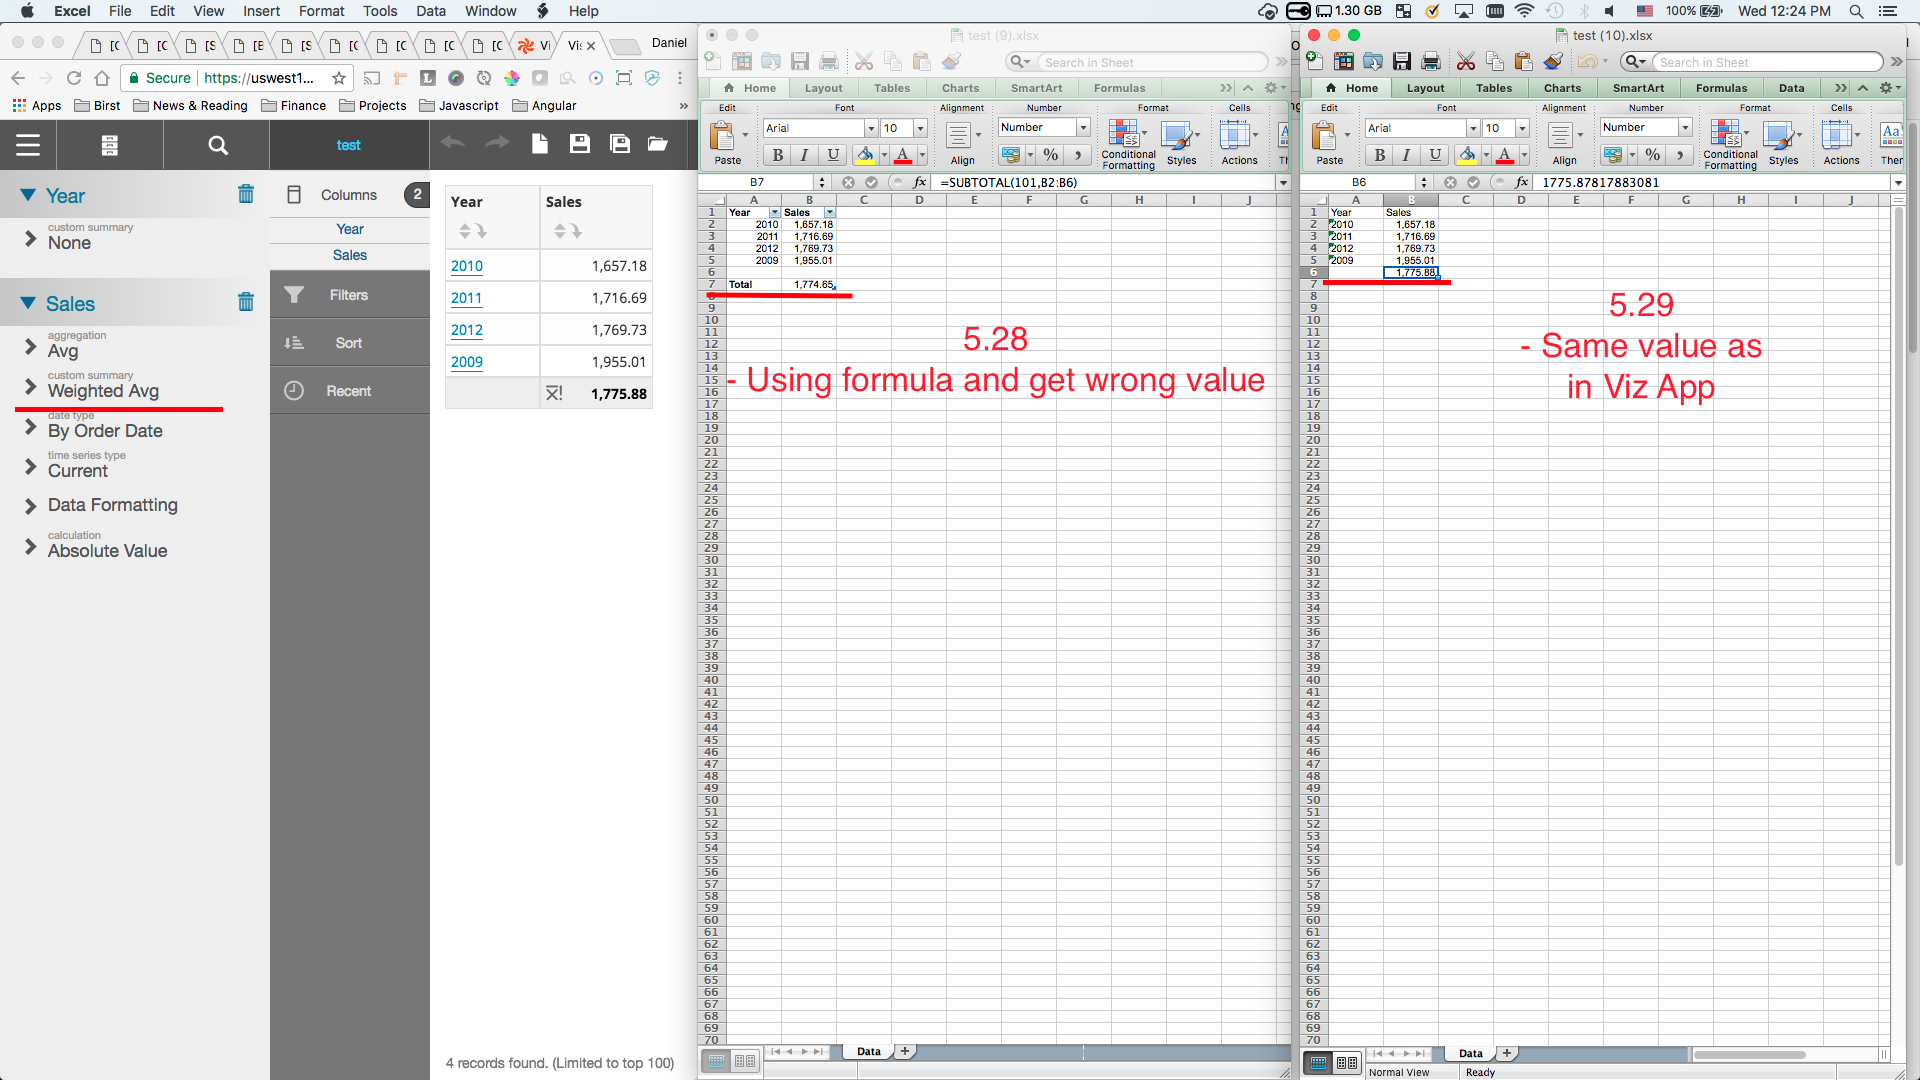
The example shows the behavior, before and after the fix, that occurs for calculating the Weighted Average custom summary where Excel was attempting to employ formulas against the data in the Visualizer in the tabular report whereas the Visualizer report could calculate the Custom Summary value against all the data in the database:

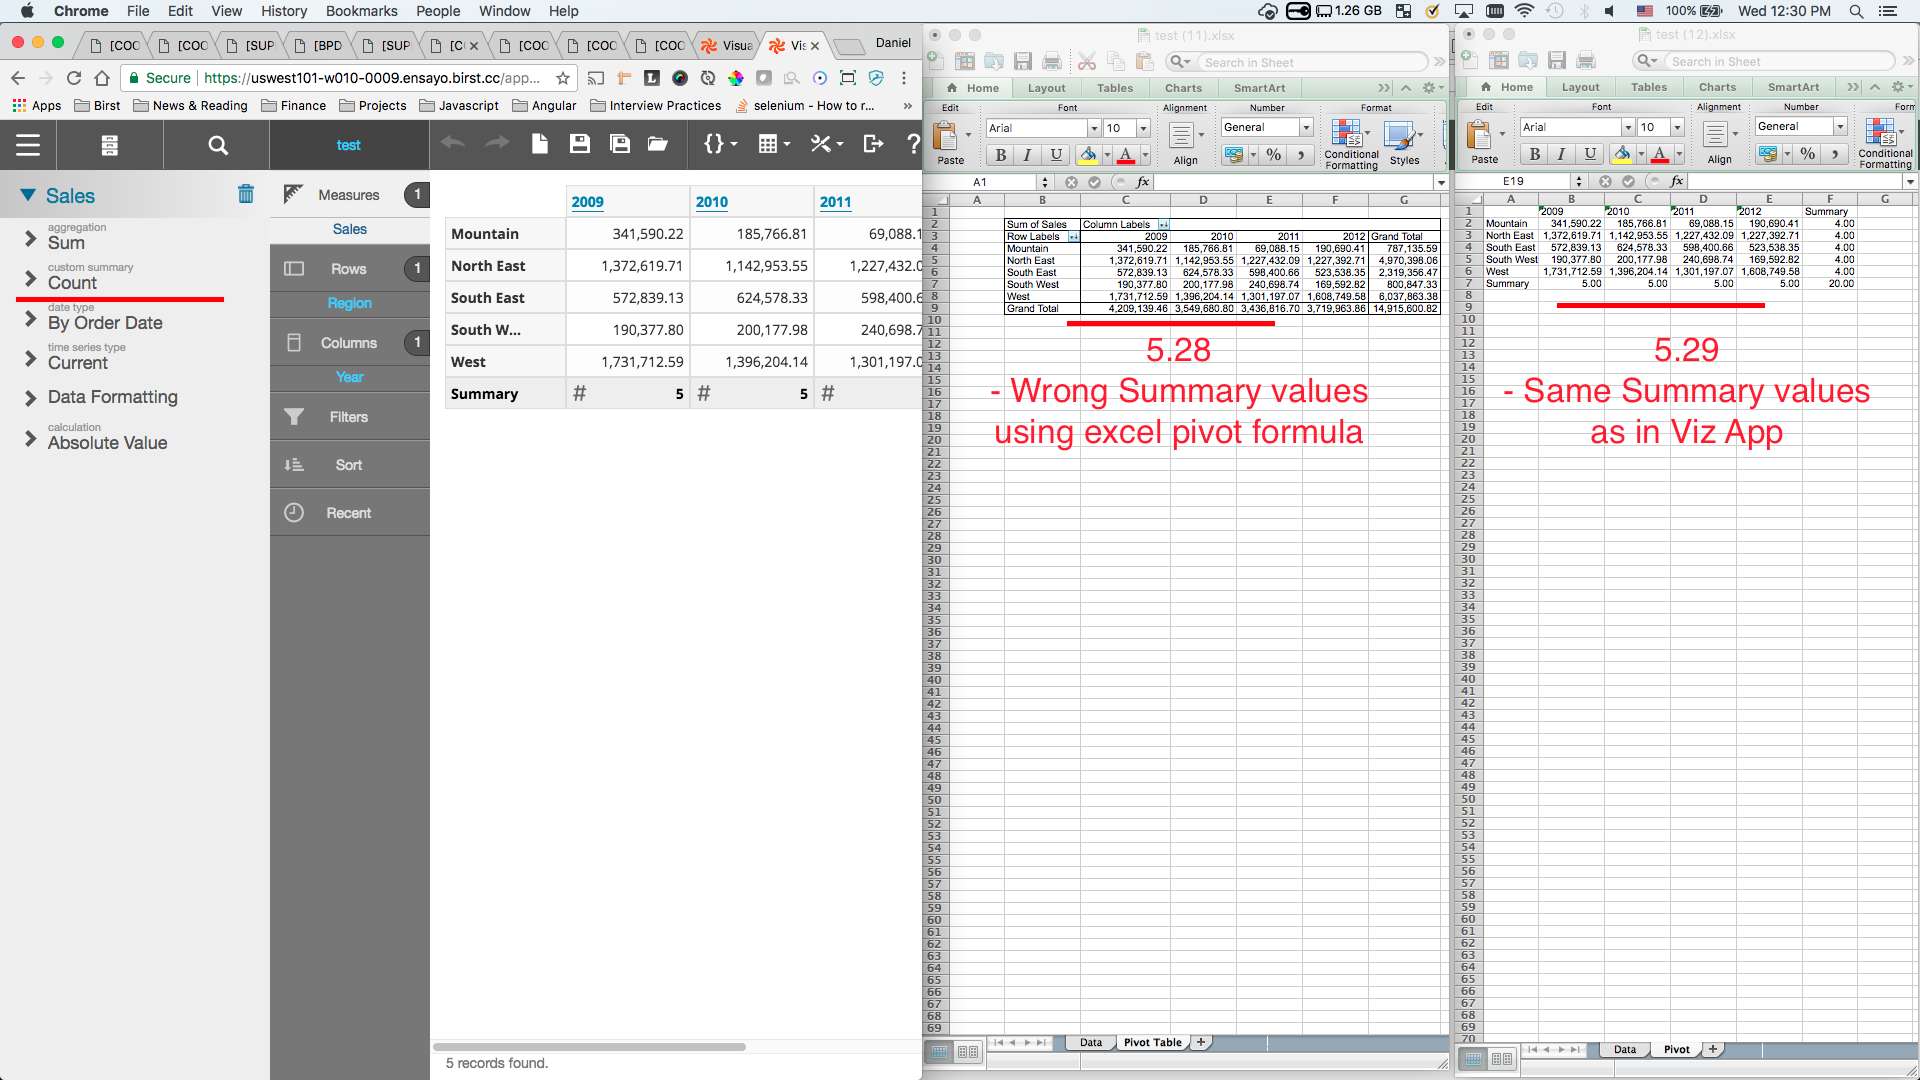
And here is a use case behavior (before and after the fix) for a Visualizer Crosstab report employing the Count Custom Summary:
