Understanding Your Smart Insights
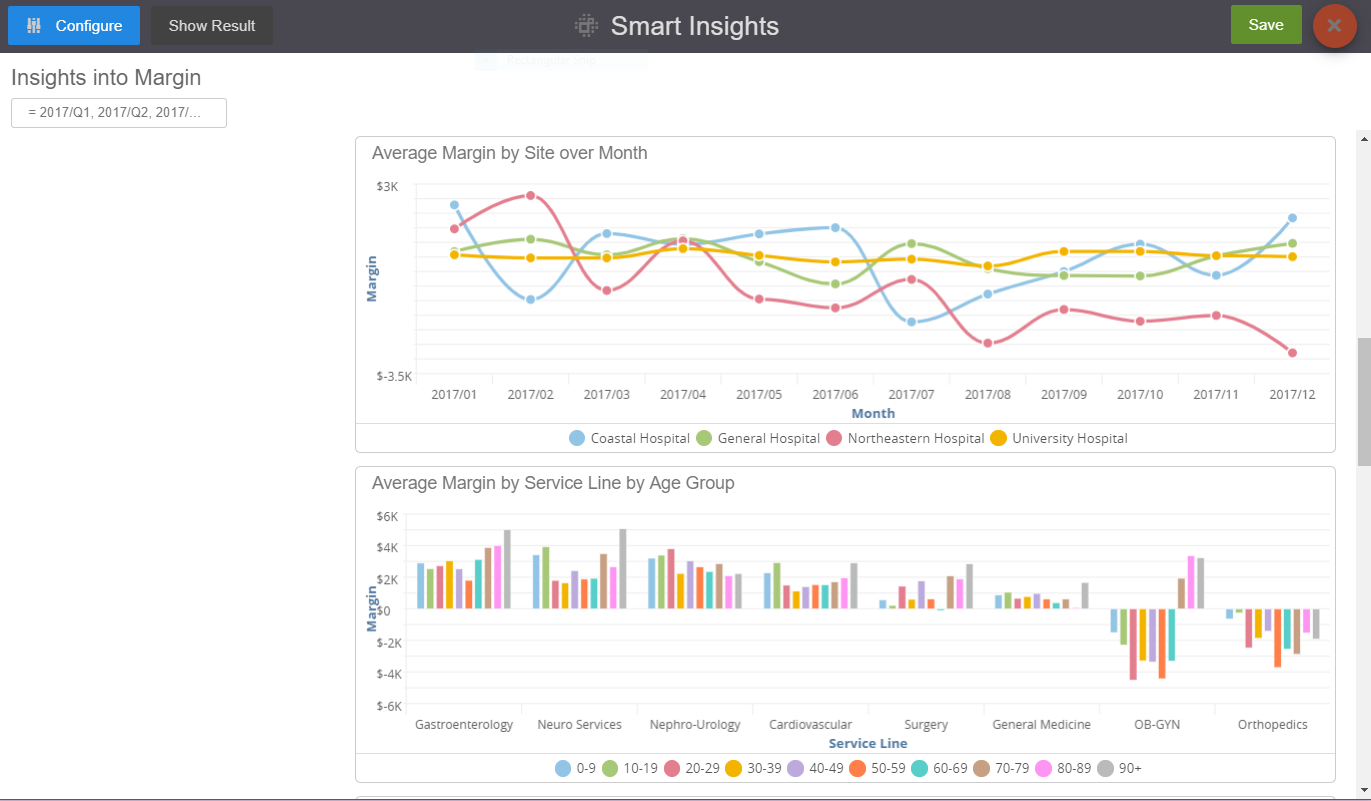
After you Configure Smart Insights, Birst will identify the attributes and measures explaining your KPI and plot them back for you using the Value Based Design guidelines in the Birst Community.
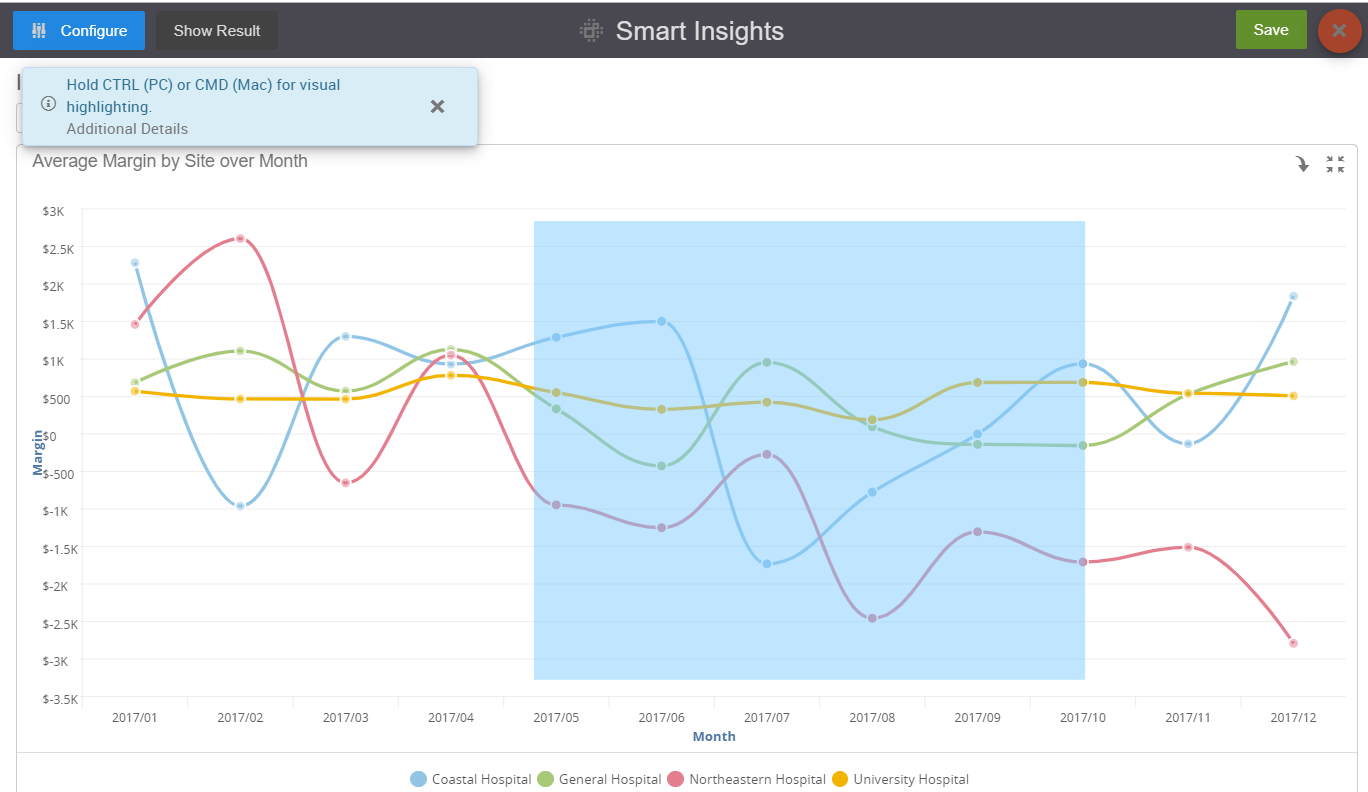
Holding down your Ctrl or Cmd key while selecting a section of one of your report will allow you to take closer views of your data.
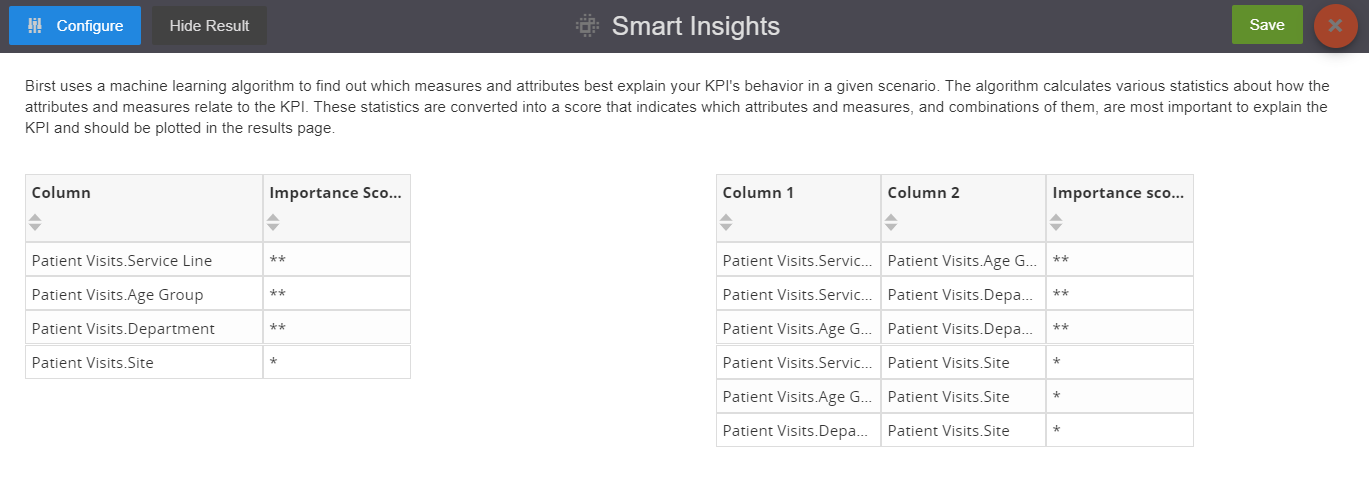
Birst uses a machine learning algorithm to find out which measures and attributes best explain your KPI’s behavior in a given scenario. The algorithm calculates various statistics about how the attributes and measures relate to the KPI. These statistics are converted into a score that indicates which combination of attributes and measures are most important to the KPI.
Click the Show Results button to view this information. Columns are ranked from four stars to one star, with four stars being the highest score. Columns that don't have significant impact on your KPI will not be displayed.

In some cases, Smart Insights may return fewer results than you expected to explain a given KPI. This could be due to the relative importance of each variable to explain your KPI.
Take for example the KPI "Profit", which you ask Smart Insights to analyze with "Discounted Sales", "Revenue", "Country", "Product Category", "Supplier".
Smart Insights may return that only Discounted Sales explains your profit. This is because Discounted Sales so strongly impacts Profit that it overpowers other variables you wish to analyze Profit with. Typically, you will see that these variables get a 4-star scores in the Results page.
Try removing these strong variables and running Smart Insights again. Without the top-scoring variable in the configuration, Smart Insights may find a few more variables to explain your KPI.

