Subject areas in Designer and Visualizer display the attributes and measures that exist in the data model for the space and are available for creating reports.
Types of Subject Areas
There are two types of subject areas:
- Default: The entire set of attributes and measures as defined in the model for the space. Space Administrators can see a diagram and manage the details of this at Admin - Define Sources.
- Custom: A set of attributes and measures that a Space Administrator can specify at Admin - Manage Access - Custom Subject Areas. It is a best practice to provide report developers with a custom subject area that shows only what is needed for reporting, has user-friendly labeling, and can be restricted to certain groups.
How Subject Areas Reflect the Model
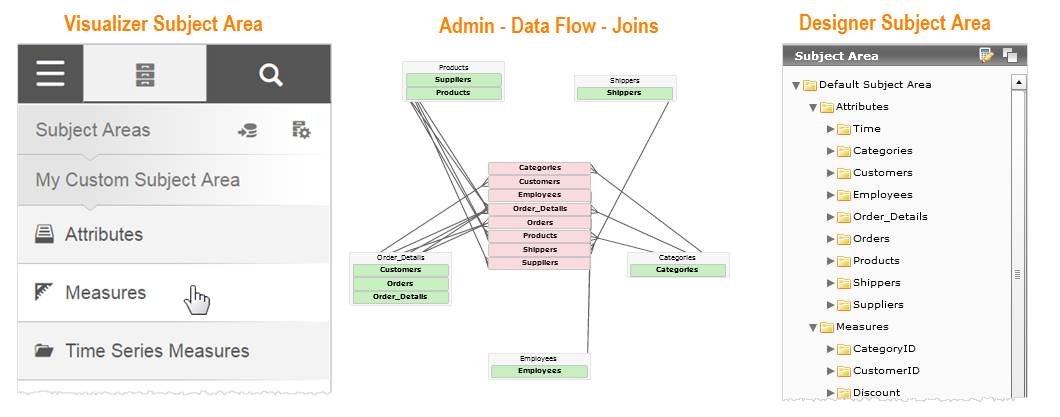
Measures and attributes have relationships as defined in the model; at the data store level this means that there are joins between the tables. The model as shown in Admin is very informative however it can become a bit complex. Subject areas simplify how measures and attributes are presented, for convenience when creating reports.
How the Subject Area Updates
When you add an attribute or measure to a report, the subject area updates to show which of the remaining attributes or measures are relevant to what you picked, and grays out those that are not.
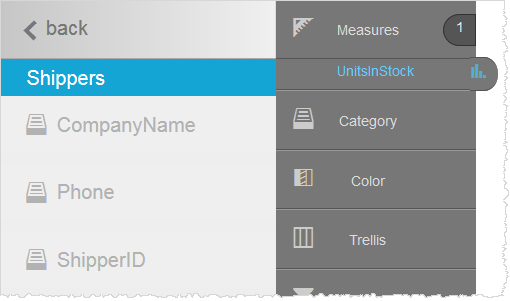
When creating a new report, the best practice is to start with a measure. When you add a measure to the report, attributes and other measures that are not related to that measure are grayed out in the subject area. For example, UnitsInStock does not relate to Shippers.
In Visualizer the Shippers attributes are grayed out:
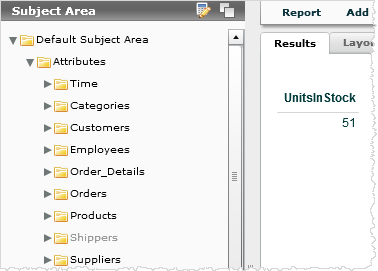
In Designer the Shippers folder is grayed out:
Similarly, when you add an attribute to the report, all measures that are not meaningful for that attribute are grayed out.
Multiple Instances of the Same Measure in Designer
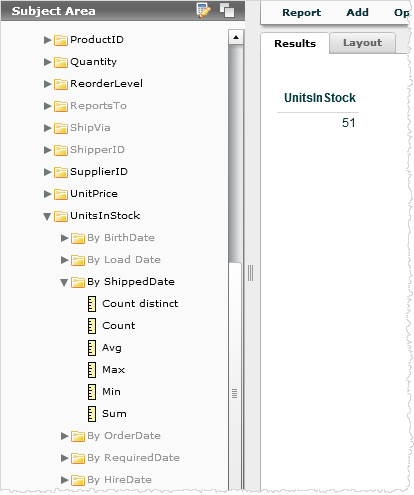
A slightly different behavior occurs when you want to add two instances of the same measure to a Designer report, for example when you want to show two different date aggregations of the same measure.
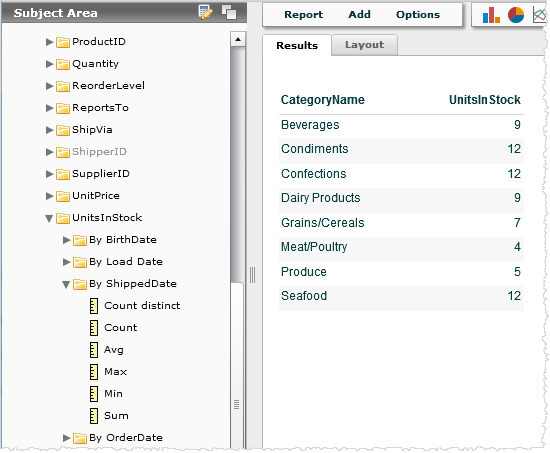
In this case, you add the first version of the measure, at which point the other aggregations of the same measure gray out. For example, after you add UnitsInStock by Shipped Date, the other aggregations of UnitsInStock are grayed out.
Then you add an attribute that relates to the first measure. The other aggregations become available again and you can add the second version of the measure.