Pivot Transform
The Pivot transform is used to transform the shape of the data of a report, typically by grouping by a set of columns and aggregating other columns. From the Prepare page, you can apply Pivot Transforms to a prepared source.
Apply a Pivot Transform
- From your prepared source, select Add Transformations. For instructions on preparing a source, see Prepare Data.
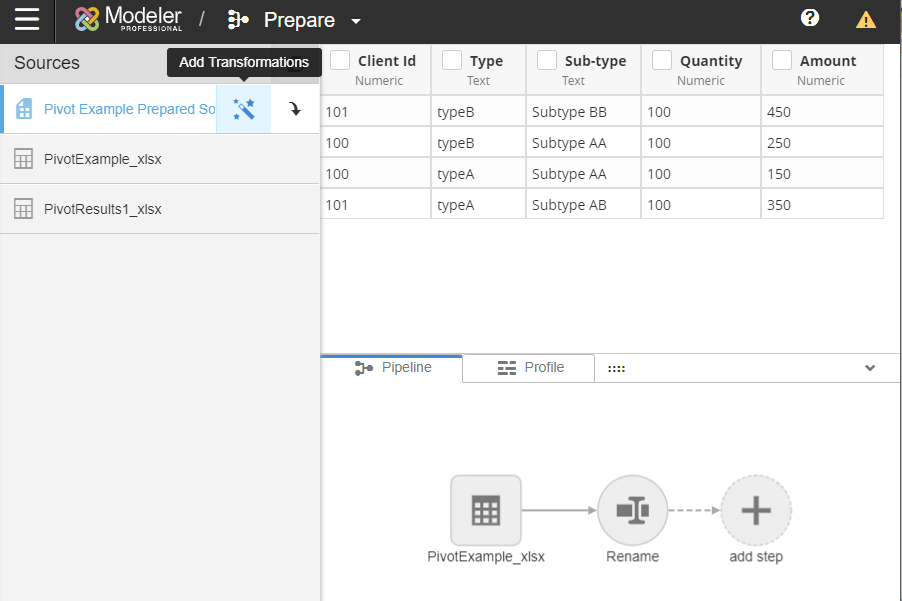
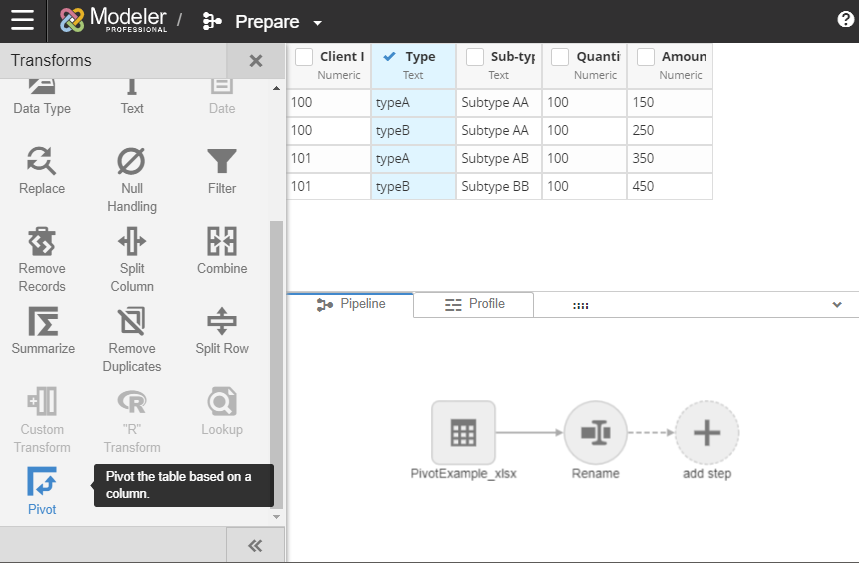
- Select the column to pivot on and click Pivot.
- Enter the information for the pivot transform.
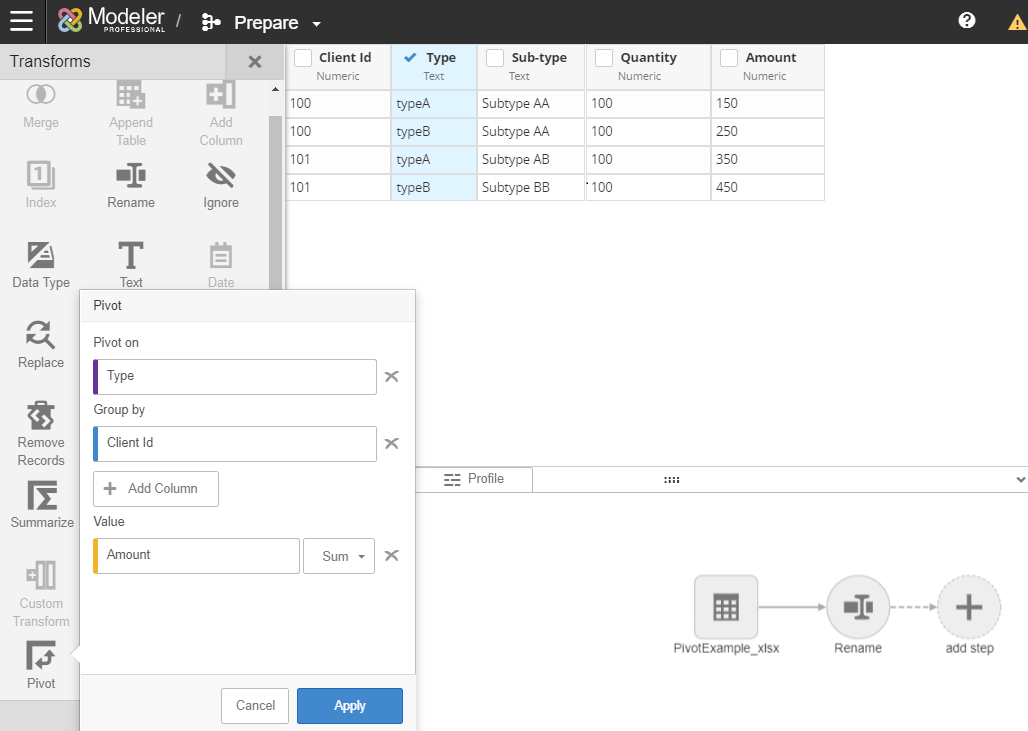
- Pivot on is the column you would like to pivot the table on. The example image pivots on Type.
- Group by groups together into a new column. You can select multiple columns to group by. If you would like to Group by all columns, select All. The example image groups by Client Id.
Value allows you to select columns to aggregate. Integers and Float columns have the options to Sum, Count, Max, Min, or Average. Varchar, Date, and Datetime columns have options for First (A->Z), Last(Z->A), Concatenate, and Count. The example image sums the Amount column.
- Click Apply. Applying the above pivot transform settings would result in the table below:
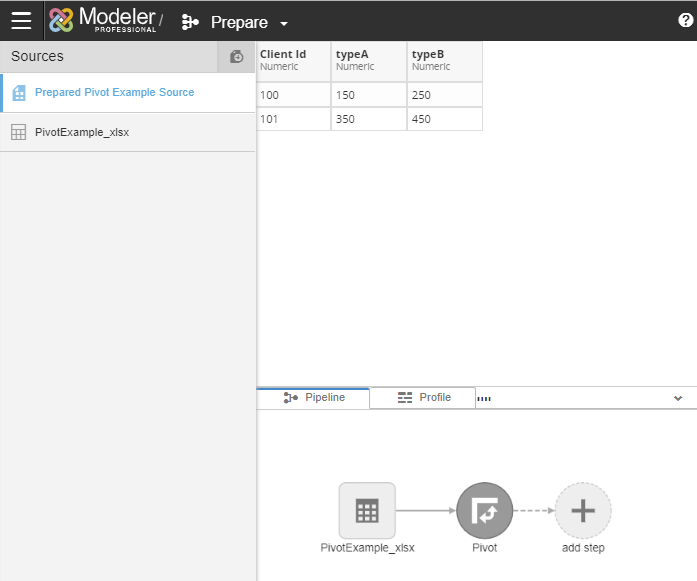
The structure of the table will not change as data is being processed in the space. The columns created when the pivot transform was applied will remain unchanged unless the pivot transform is refreshed. There is a limit of 50 new columns created using the pivot transform.