How do I interact with charts on Android
The following examples show how to do basic activities with a chart.
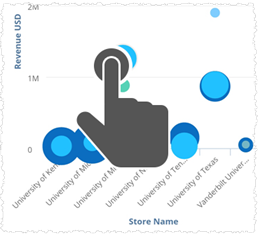
Tap on a column or point to see its tooltip.
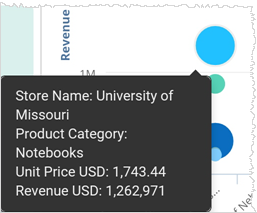
If there is a Drill Down button in a tooltip, tap it to see a new chart that has lower levels of detail.
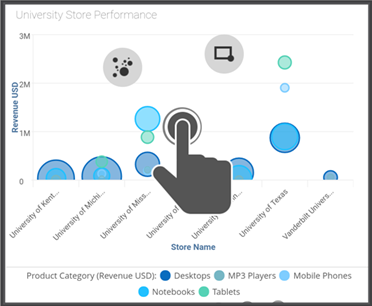
Starting in 5.25, some charts can have alternate views of different data. You can change the views with the View Selector.
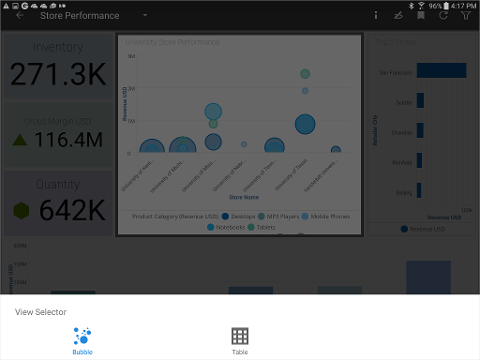
Press on a chart to bring up the chart menu items. If the chart has an alternate view, you see the View Selector bubble.
Drag to the View Selector bubble.
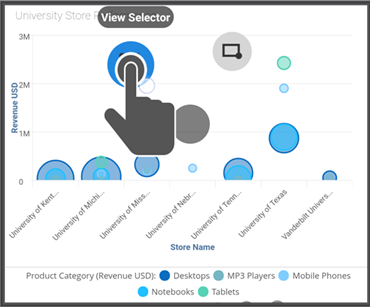
At the bottom of the screen, tap to select another chart style. Available styles depend on the type of data in the original chart. Birst shows only those chart styles that will display the data.
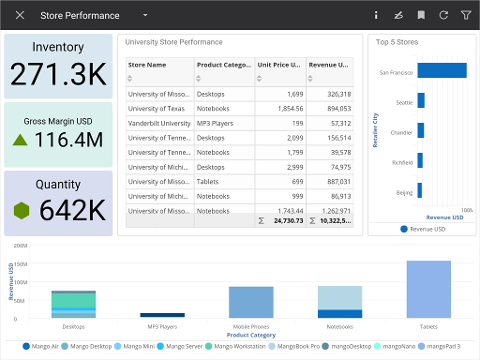
The chart re-draws to the new style.
Tip: You can use the View Selector menu again to change it back.
Related FAQs:
How do I navigate dashboards on Android?
How do I see more information about a column on Android?