Can I change the columns that are shown in a chart on iOS?
If a report has been set up for it, you can pick different data to show. For example, a report may show revenue by quarter, and you can change the same report to show gross margin by quarter. This feature is called a column selector.
The examples here show iPhone and it works the same on iPad.
To see column selectors tap and hold (long press) in an empty area to reveal the Column Selector menu.
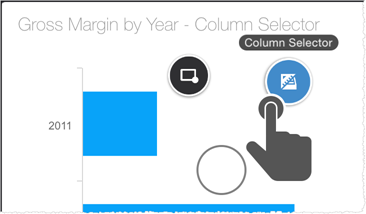
Keep pressing and slide over the menu item. The Column Selector screen opens.
Tap Attribute or Measure to see the possible options.
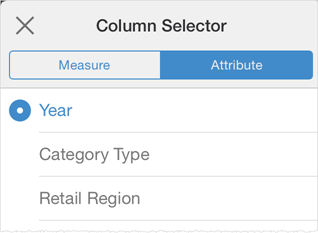
The chart re-draws with the new data.