Creating a Custom Subject Area for OCI
Space Administrators can create custom subject areas that are a subset of the attributes, measures, and Designer save expressions that are available in a space default subject area. The default subject area contains all the attributes and measures. This topic discusses custom subject areas in the context of the OCI/ODBC Driver product. Custom subject areas are a Best Practice for organizing data for use by ODBC clients such as Tableau.
- To create a custom subject area for an OCI client
- To verify the custom subject area before importing to the ODBC client
Important: The ODBC Driver configuration has the option "Use Subject Areas". It is on by default when installing the driver. See Using the ODBC Driver.
For more general information about custom subject areas, see Creating a Custom Subject Area.
Best Practices:
- Always create custom subject areas for use with ODBC clients such as Tableau. Custom subject areas can help focus the user's attention on only those attributes and measures that are relevant for their needs.
- Create only one custom subject area for an ODBC client. Joins between two subject areas are not supported.
- Access to custom subject areas is assigned at the user or group level. If there will be multiple users of the ODBC client, consider setting up a group for them.
- With some ODBC client integrations you may not need all of the Birst custom time series. Custom subject areas allow you to exclude the time series attributes and measures. For example, with Tableau use only what you need for reports, otherwise the workbook could contain many extra columns that you don't need.
- ODBC clients such as Tableau may not have knowledge of, and therefore may not be able to indicate to users, what joins are possible between columns. Use custom subject areas to show only those attributes and measures that can be successfully joined.
- Use labels in custom subject areas to give user-friendly names to attributes and measures.
To create a custom subject area
- Go to Admin - Manage Access - Custom Subject Areas.
- Click New, or drag an element from the Default subject area list to the Work area. The Subject Area Properties dialog opens.
- Enter a name and description.
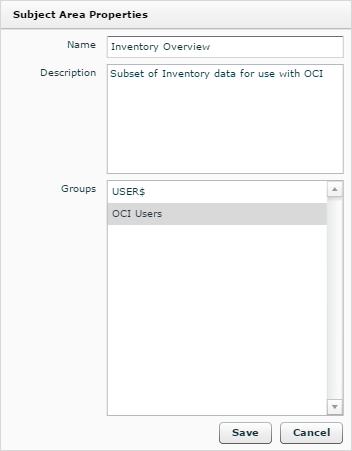
- Select the user groups that will have access to this
custom subject area. For example, if there is a group for OCI client users, select that group.
- Click Save.
- Drag and drop folders, attributes, and measures from
the Default subject area to the work area.
Tip: You can drag over a folder, then delete what you do not need.
Best Practice: You do not always need the Birst Time Series, but often you do need time-based attributes, such as Date, in reports. Include time data when it is in your source. - Optionally, change folder names to what you want
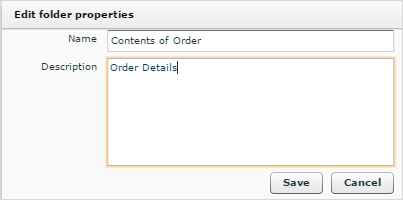
users to see. Right-click on the folder in the work area and select Edit
Properties. In the Edit Folder Properties dialog enter a new name and
provide a description. Descriptions appear as tooltips for the folders.
- Optionally, rename attributes and measures to what you want users to see. Right-click on the element in the work area and select Edit Properties. In the Element Properties dialog box, change the tree label, column label (the default name used on reports) and provide a description for the tooltip.
- Optionally add folders to reorganize the attributes
and measures. To add a folder, right-click on a folder or the root subject
area in the work area and select Add Subfolder. In the Add Folder dialog
enter a name and description.
- When you are finished creating your custom subject
area, click Save.
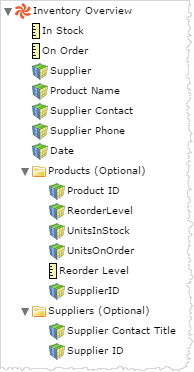
Best Practices:- Put the most commonly used attributes and measures at the top level so users don't have to click too much.
- Put "extra" or "optional" items in folders. End users of Tableau can later choose to keep them, rename them, or hide them.
To verify the custom subject area before importing to the ODBC client
Use Visualizer to verify that you have all the attributes and measures needed for reports, and that they will properly join to each other.
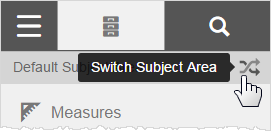
- In Visualizer, switch from the default subject area to the custom subject area.
- Drag and drop attributes and measures to make one or more test reports.
Important: If you add a measure to the report, and then an attribute becomes grayed out, then it will not join properly in an ODBC client. Go back and check the data model.
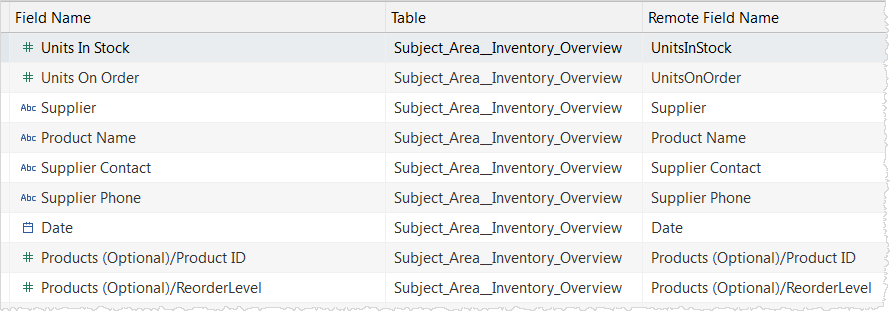
Tip: The custom subject area labels that you may have customized are used in Tableau field names. They are not used in Visualizer or Designer report labels.
For example, subject area fields in Tableau:
For example, subject area columns in Visualizer:
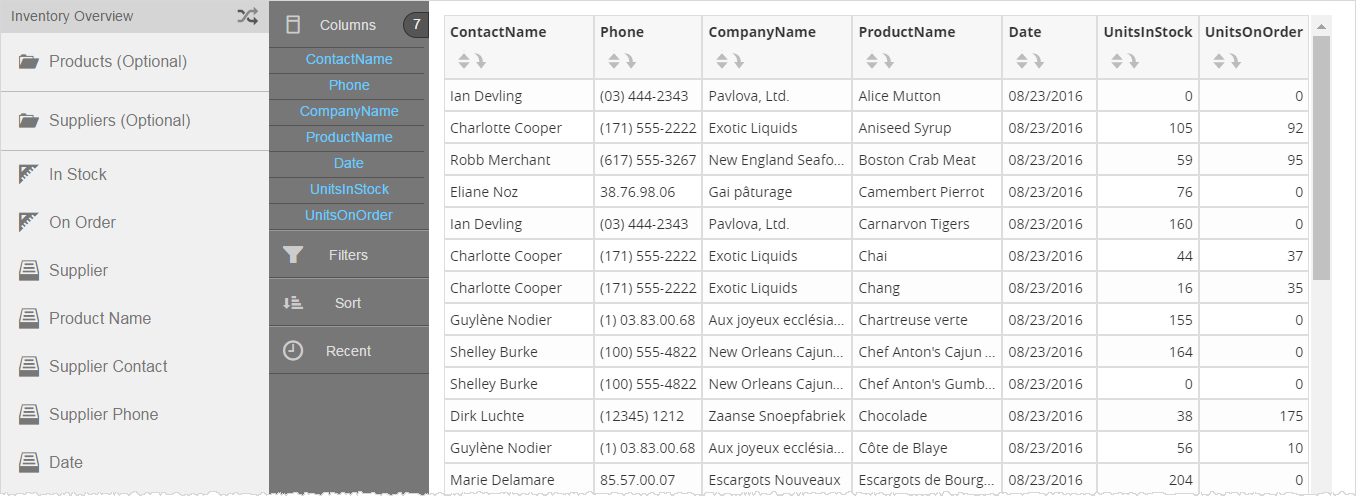
You can change column labels in Visualizer or Designer reports, as well as in Tableau reports.